In my last blog entry I mentioned that the health cost measured by the LIK went down by -0.43% throughout the year 2022 while at the same time the health premiums increased by 6.6% on average for the year 2023 compared to 2022. The raises some interesting question to me. I am very curious to learn more about the connection with regards to health costs of the LIK compared to the development of health premiums over time. To understand this better, we need to look into how the health costs measured by LIK have evolved over a longer period. Secondly, it’s pivotal to understand what parts contribute to the health costs measured by the LIK.
Historical view of health in LIK
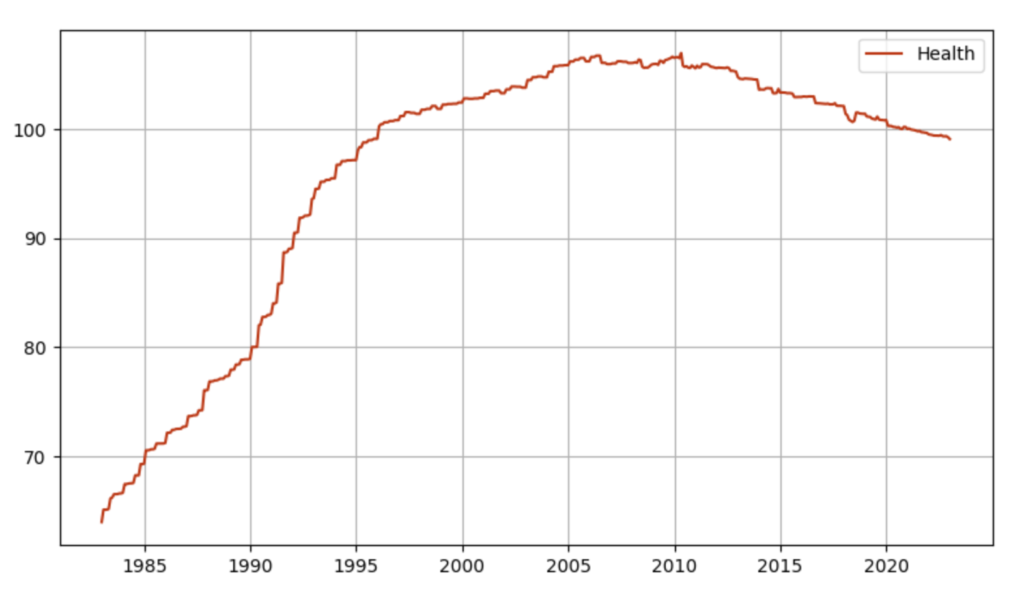
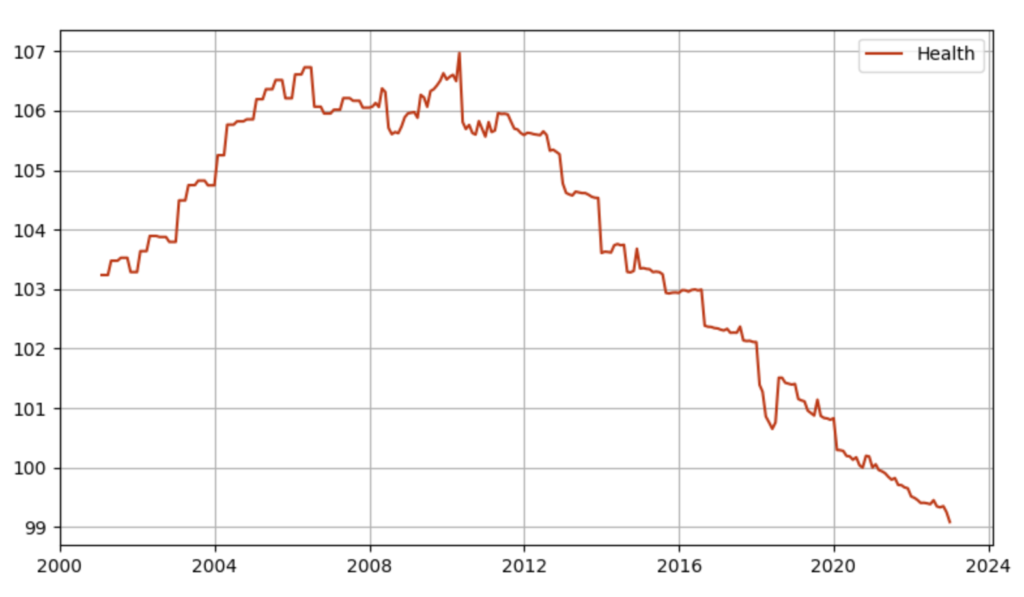
The data is available since 1983 until today. The data source stems from the Swiss Federal Statistical Office and can be found here. Figure 1 below shows how the health category evolved over time. The relative increase between 31.12.1982 and 31.12.2022 was 54.87%. There was a relative steep increase in the eighties and nineties. We can see that the health costs measured by LIK peaked on 30.04.2010 April 30, 2010 when zooming in over the last two decades in figure 2. After this point i.e. about the last 13 years the health costs measured by LIK decreased by around 7.4%.
Subcategories of health
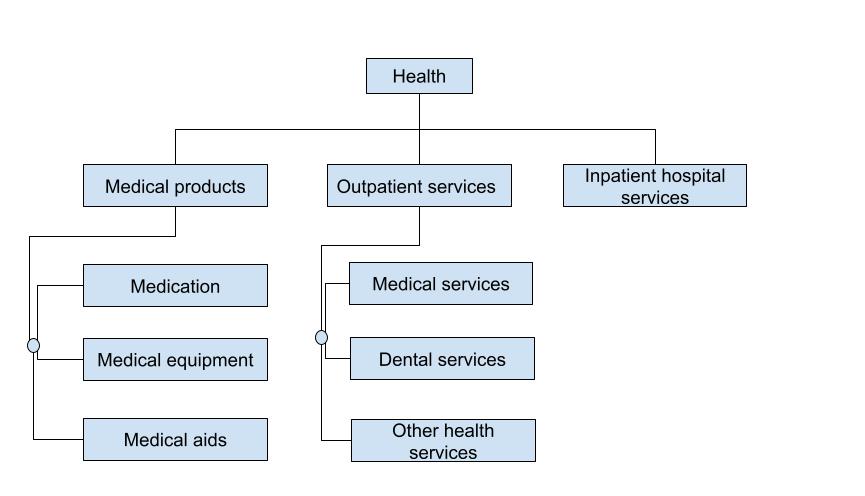
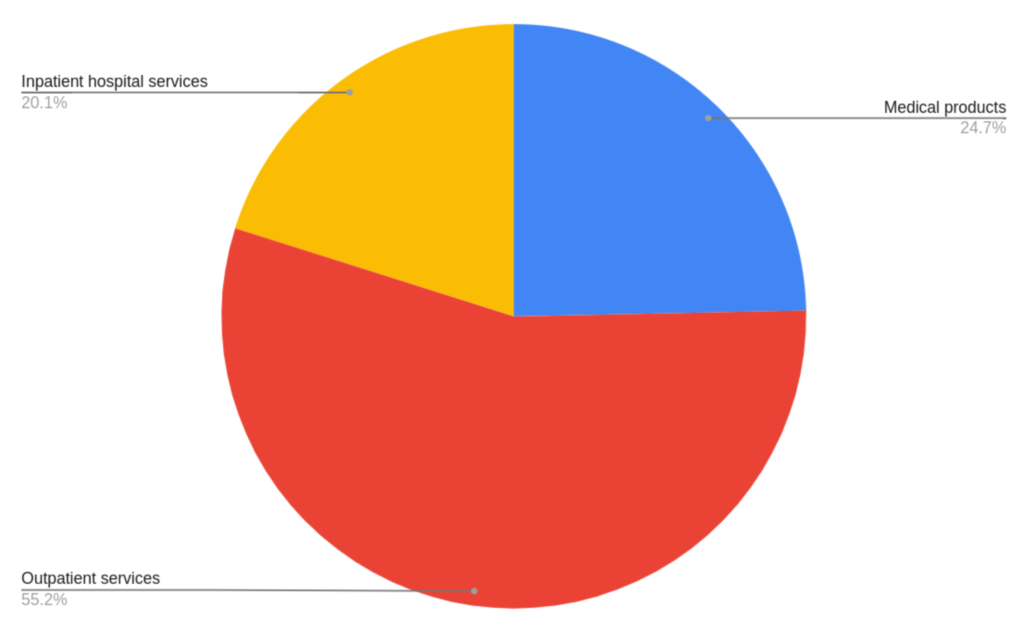
The Swiss Federal Statistical Office splits the health category into several sub- as well as sub-sub-categories. In the diagram in figure 3 below you can see the names of the two lower sub-hierarchies of the health category of the LIK. The health category had a weight of around 16.7% in 2022 in the overall LIK indicator. The share of the subcategory “outpatient services” within the whole health category was 55.2% while the other two subcategories i.e. “medical products” and “inpatient hospital services” accounted for 24.7% respectively 20.1% as depicted in figure 4. Please note, “outpatient services” refers to procedures and treatments which do not require a patient to stay in the location of a procedure for additional monitoring or care. More details between the difference of outpatient and inpatient services is given in here.
Sub-category drill-down
The question arises whether these three subcategories moved in tandem over time or not that resulted in the evolution of the overall health category as shown in figure 1.
Outpatient services
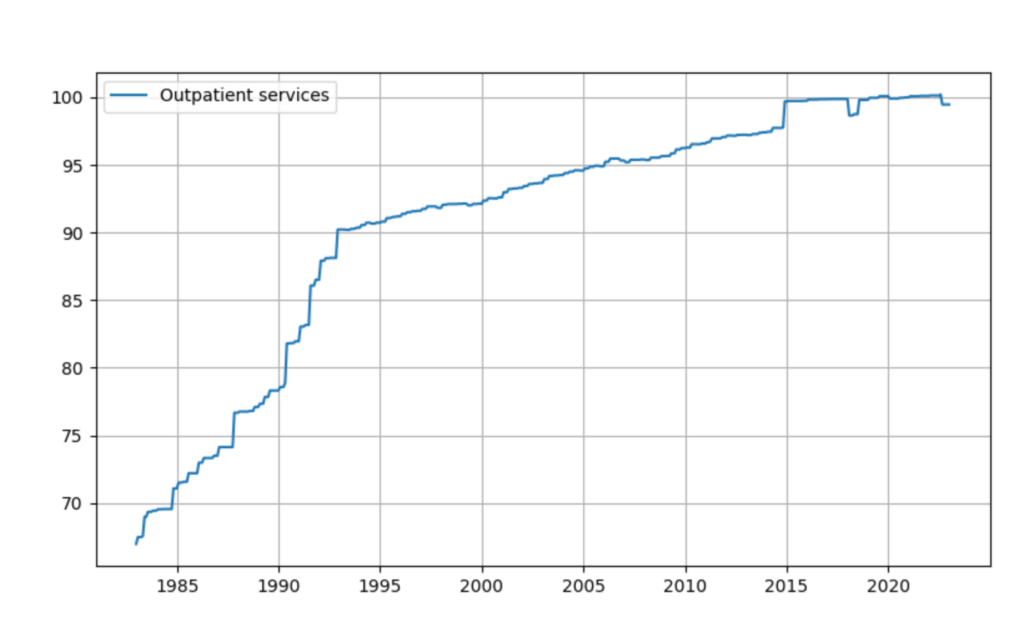
Figure 5 shows how the subcategory “outpatient services” evolved. We see that there was a very steep rise throughout the eighties and early nineties. Afterwards, it rose with a relatively constant pace to the end of 2014. From then until the end of 2022 the increase was even flatter. The two kinks we see in the graph look somewhat suspicious. I do not believe that they are down to some demographic change as they occurred so sudden. I rather believe that those changes are down to a change to which parts belong to this subcategory. The important observation here is that the subcategory “outpatient services” did not contribute to the decrease of health cost as of 2010 even though it is the lion’s share of the health category as it never really fell.
Inpatient hospital services
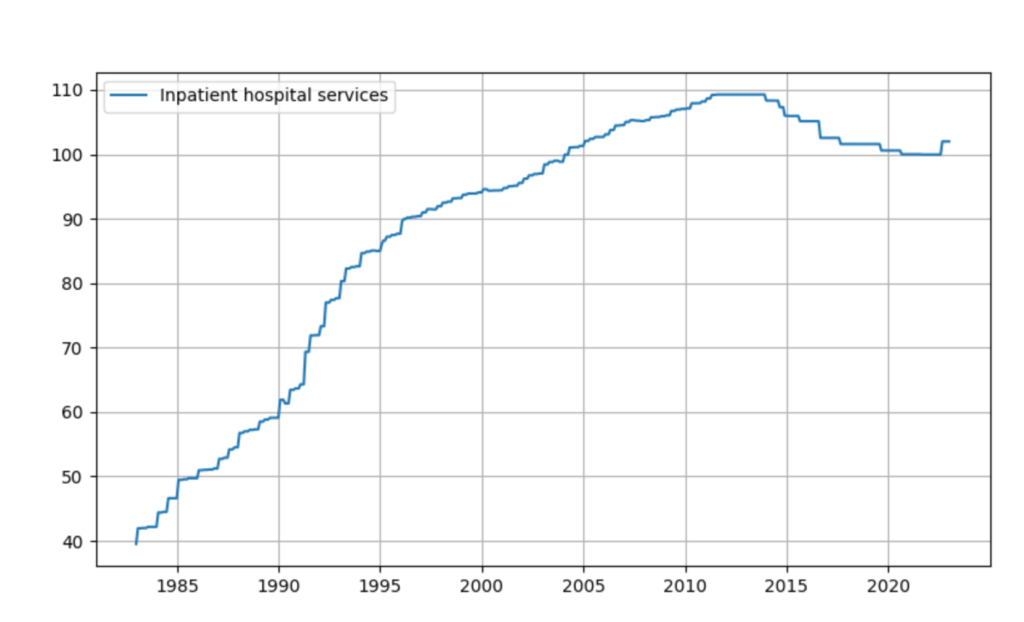
Figure 6 below shows how the subcategory “inpatient hospital services” evolved. We see that between 1983 and 2010 the cost for inpatient hospital services rose about 173.73% i.e. about 3.8% per year. After that it became flat and even started to fall. Between 2010 and the end of 2022 the cost decreased about 4.72%. The overall increase between 1983 and the end of 2022 for this subcategory was about 158%. This is much more than the 54.87% for the overall health category.
Medical products
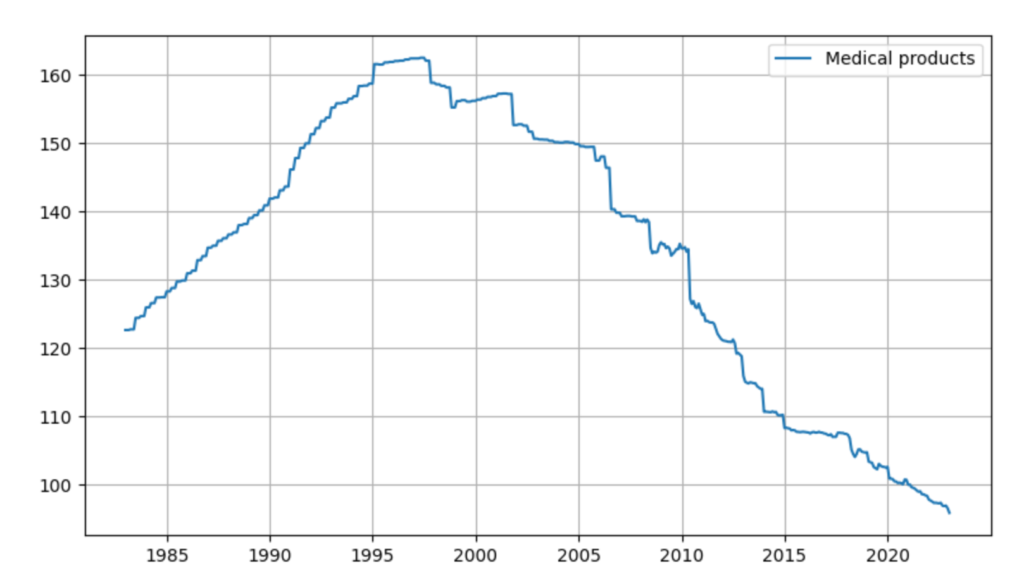
Figure 7 below shows how the subcategory “medical products” evolved. Again we see that there was a steep increase throughout the eighties and part of the nineties. Between 1983 and 1997 the prices for medical products increased by 32.4% i.e. 2.03% per year. This trend reverted shortly afterward. Between 1998 and the end of 2022 the prices were slashed by 39.62%. Over the whole period i.e. between 1983 and the end of 2022 the prices for medical products went down by 21.82%. The decrease of prices for medical products between 1998 and 2022 is one of the main driver that the overall health category experienced also a reduction between 2010 and the end of 2022 as visible in figure 1.
Conclusion
While the overall health costs have increased since 1983, we see that as of 2010 the prices started to decrease. The main driver for this development is that medical products became cheaper since 1998. Also we see that the subcategory “inpatient hospital service” became less expensive after 2010. Nevertheless, so far we cannot see a significant trend-reversal in terms of increased prices for the subcategory “outpatient services”. How those insights connect to the developments of the health premiums remains to be seen in follow-up blog entries.
If you want to play around with the different sub- and sub-sub categories of the LIK check out the new toolbox site: