In the analysis of part II of the estimation of dividend growth we could see that there are two different maxima in terms of best filtering techniques that appear to perform best estimating next year’s dividend growth when using the root mean square deviation as a measure to compare the different techniques. The two maxima are either rolling ema or rolling geometric average with a window size of five years or taking last year’s estimate as shown in the figure 1 below. Just sticking with one of those filter techniques and ignoring the other might lead to high errors when applied to all stocks in one’s portfolio. Thus, this post tries to analyze whether the estimation technique can be adapted in order to find a technique that clearly outperforms the others.
Estimate dividend growth with outlier rejection
We have seen that in cases as for security like NWL taking last year’s dividend growth estimate works better than using the ema filter with a window size of 5 years. The reason for this behavior appears to be that the dividend growth rate exhibits oscillatory behavior as shown in figure 2 below. We see that there was a sharp increase in paid dividend in 1998 and then a sharp decrease in 2008.
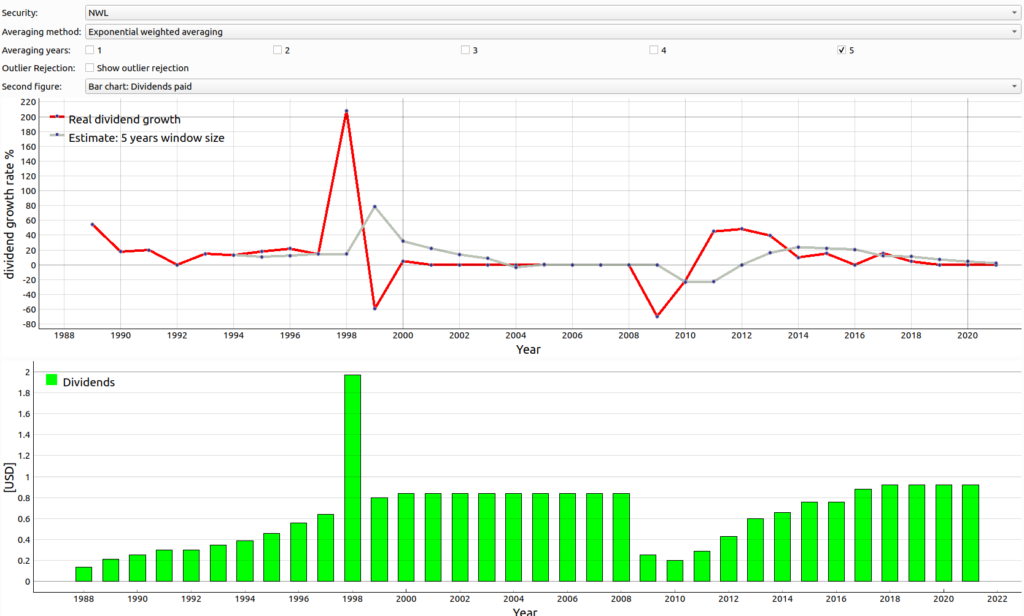
Figure 2
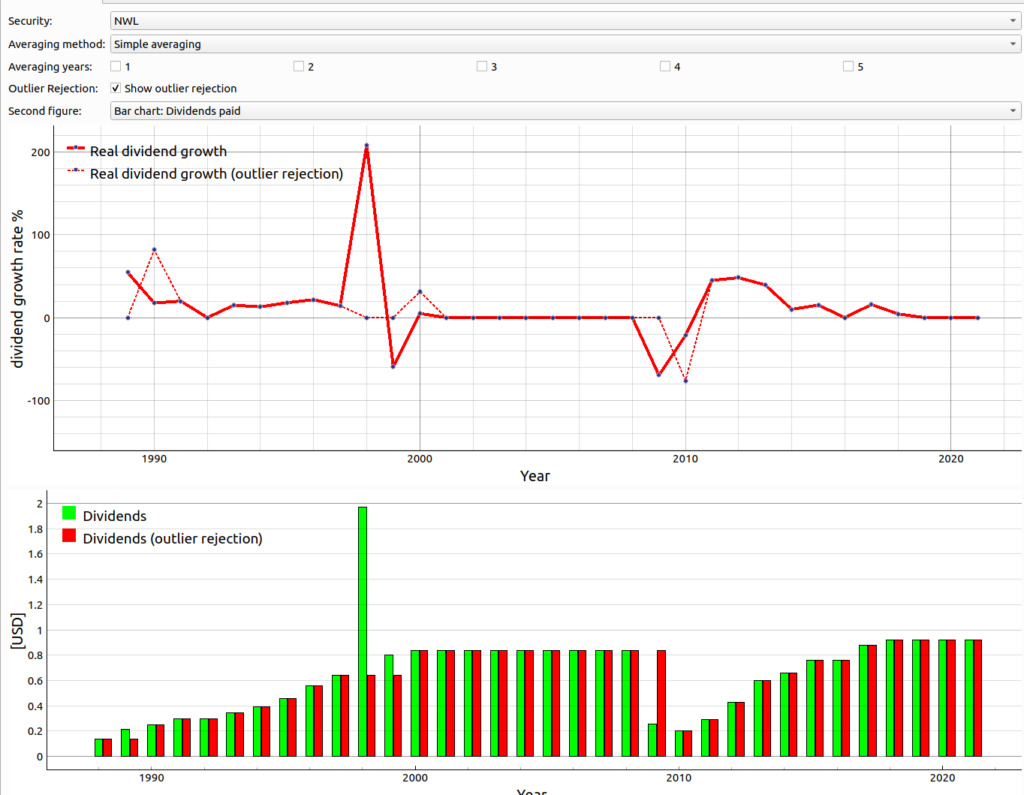
The idea of an adaptive approach to estimate the dividend growth rate is to try to apply an outlier rejection logic. More concretely the outlier rejection logic would reject the next year’s paid dividend if the norm of the growth rate exceeds a certain limit. We used a rejection threshold of 50%. We demonstrate the effect of this outlier rejection on the example of the security NWL in the figure 3 . There you can see that the dividend growth rate with outlier rejection (red dotted line) goes to 0% in 1998 and 1999 because the norm of the real dividend growth rate was greater than 50% for those years. Hence, the assumed paid dividends for those two years was the same as in the year 1997 as shown with the red bars in the lower plot of figure 3.
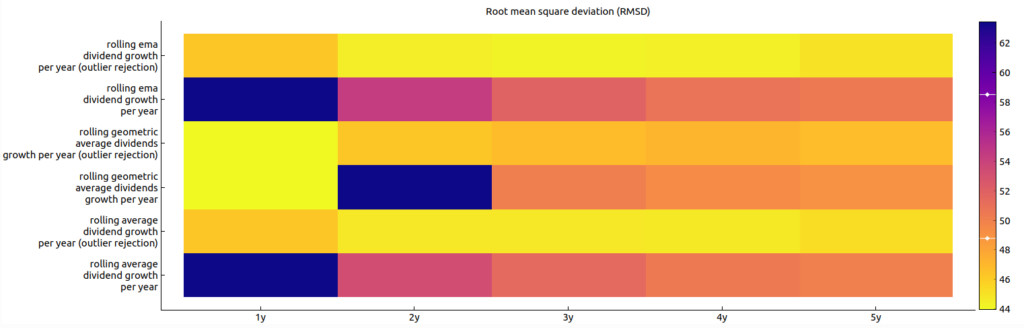
In figure 4 we visualize how the the exponential moving average using the dividend growth rate with outlier rejection versus without outlier rejection behaves with the example of the security of NWL. We can clearly see that the deviation of estimation using outlier rejection (gray dotted line) to the real dividend growth (red line) is smaller than when taking the values without outlier rejection (gray line). This is also visible when comparing the root mean square deviations of the different filtering techniques as shown in figure 5. However, while we see that the ema filtering with a window size of 5 years and outlier rejection performed better than the ema filtering with a window size of 5 years and without outlier rejection we see that just taking last years’s estimate is still somewhat better.
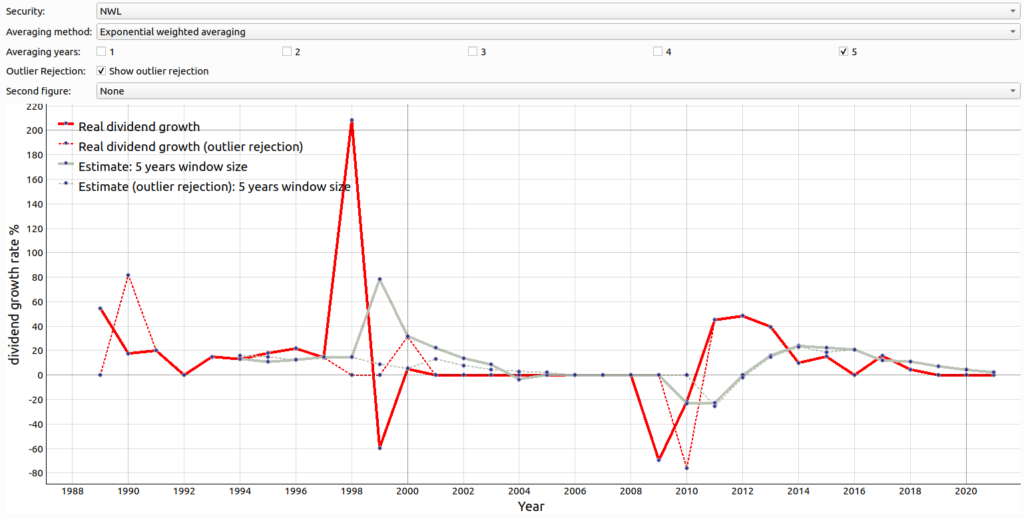
Figure 4
The best averaging method with and without outlier rejection over several portfolios
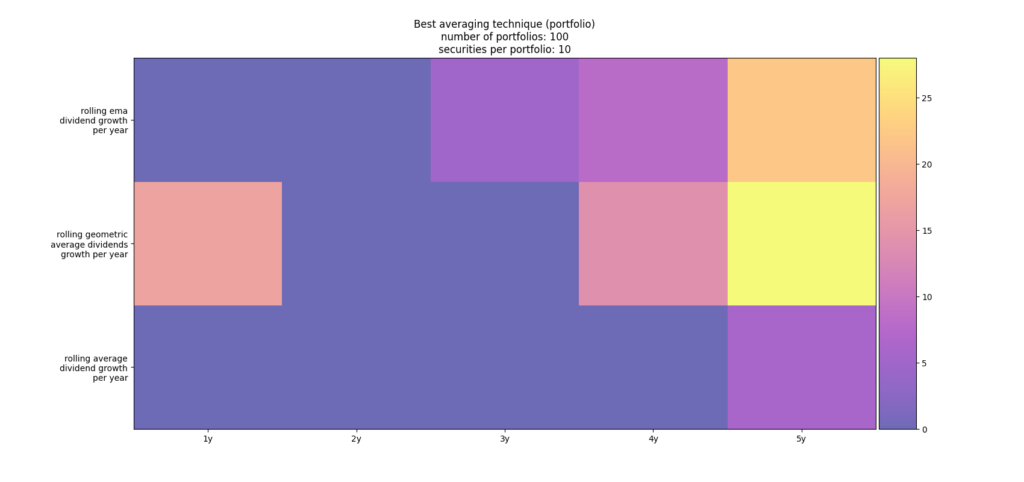
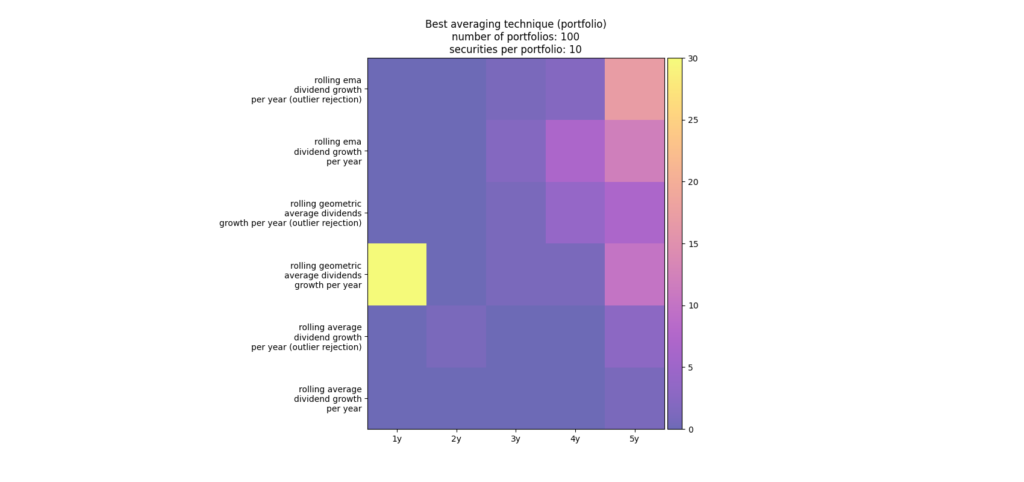
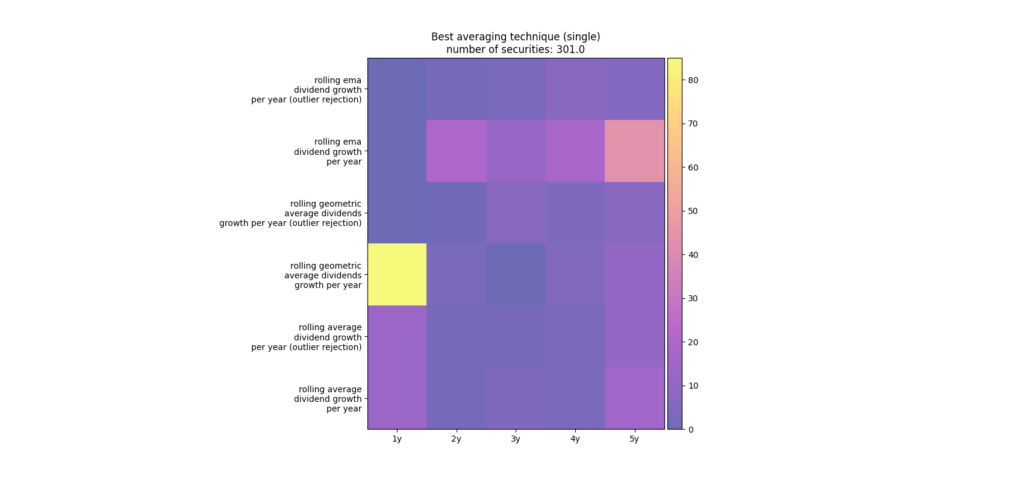
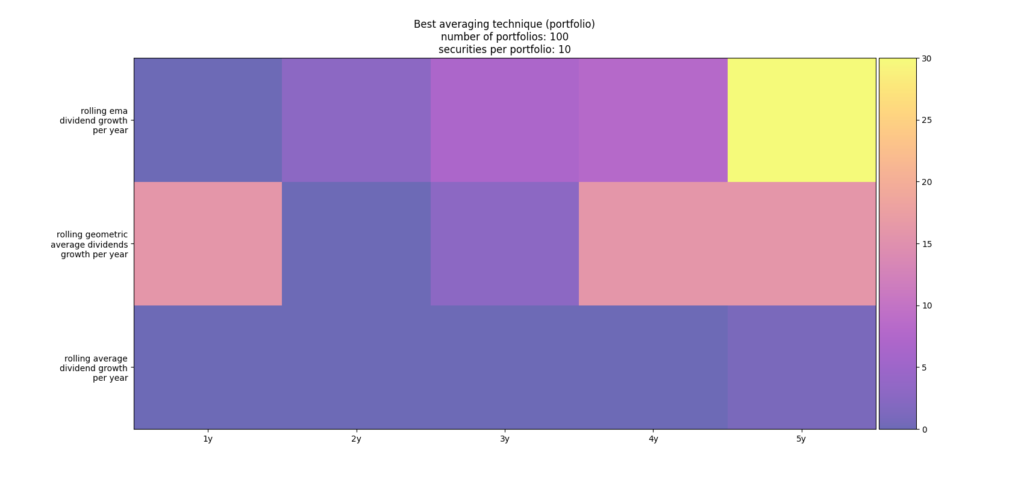
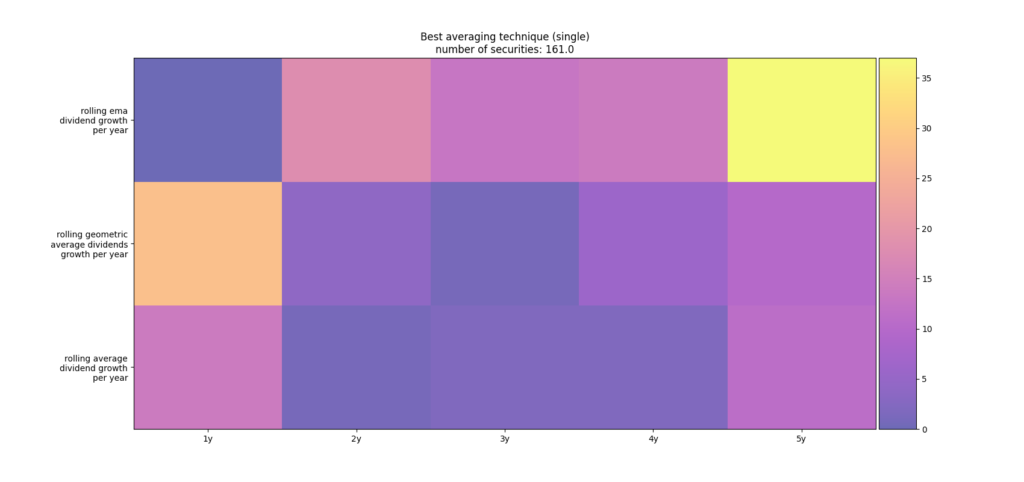
In the foregoing example we have seen that the root mean square deviation can be reduced by using a logic of outlier rejection. The question arises how well the outlier rejection performs over several portfolios when using the root mean square deviation analogous on how it was done in the previous blog. For that purpose we have re-run the simulation for all the filtering techniques. Figure 6 shows the count array of the best filter techniques considering 100 portfolios with each consisting of 10 randomly selected securities that paid continuously dividends. You can see that the while rolling ema over 5 years with outlier rejection worked fairly well taking last year’s growth rate was in average over all portfolios still the better technique. Figure 7 shows the count array when checking which filter technique worked best for each single securities. Interestingly, in this scenario the rolling ema over five years without outlier rejection was actually better than with outlier rejection. The reason for this difference when compared to considering the root mean square deviation of portfolios of several stocks is that the outlier rejection technique mainly works for only several stocks that exhibit this steep changes as e.g. NWL in figure 4. If such a stock is in the portfolio, the root mean square deviation over the whole portfolio is smaller when applying the outlier rejection versus without outlier rejection logic.
Ignoring oscillatory dividend growth stocks
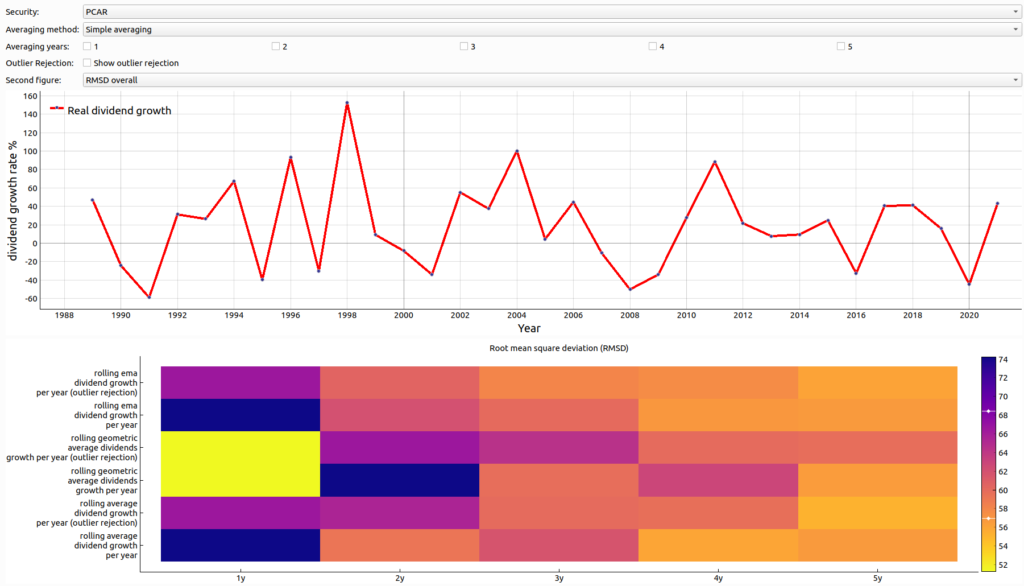
In the previous section we have shown that even with outlier rejection taking last year’s estimate works in average still the best. The question is whether there is a method to separate stocks whose estimation strategy is taking last year’s estimate versus taking the rolling ema filtering with a window size of 5 years. If we could distinguish such stocks, we might be able to device an adaptive approach that would apply the best strategy based on the past stock behavior. To answer this question, it is best to consider stocks whose best strategy is taking last year’s estimate. As example we take the stock with ticker PCAR as shown in the figure 8 below. As you can see the root mean square deviation is best by taking the last year’s estimate. Furthermore, you can see the the dividend growth rate exhibits an oscillatory behavior going several times deep into negative growth territory. We re-run our simulation from above by filtering out stocks that have more than one crossing from positive dividend growth to negative dividend growth.
The results of the simulation are visualized in figure 9 with the well-known count array for the simulation of 100 portfolios each consisting of 10 stocks. As you can see if we remove the oscillatory stocks, the best averaging techniques in terms of root mean square deviation is the rolling ema with a window size of 5 years. Please note for this simulation we have not considered the outlier logic. The same is true if we compute the count array based on the best averaging technique of every single stock as shown in figure 10.
Conclusion
We could show that applying an outlier rejection logic can account for some cases for which taking last year’s estimate was best. However, the outlier rejection logic alone fails to outperform the other filter techniques. Hence, we cannot just use this technique. On the other hand, we could show that by filtering out stocks that exhibit an oscillatory behaviour in terms of dividend growth rate using rolling exponential moving averaging outperforms the other techniques. The question to be answered is whether we can find an adaptive approach that would select change the estimation strategy per stock on the go based on the history of the dividend growth must be further analysed.
If you want to execute the simulation yourself, please visit the quant page of finspresso on Github.