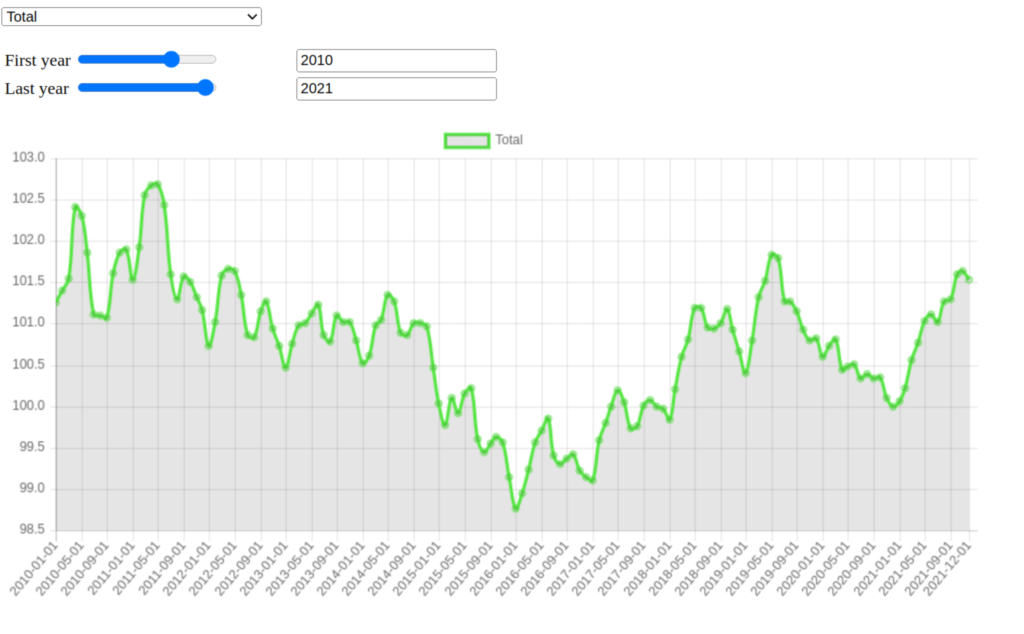
The inflation in Switzerland between the 01.01.2010 and the 31.12.2021 moved only from a level of 101.254 in the beginning to 101.523. I.e. the prices on aggregated measured by the LIK edged up only 0.266% over this 11 year period. Using the geometric mean formula we compute an annualized inflation rate of around 0.0241% for this period. In my view this is the absolute embodiment of price stability! The figure below depicts how the total inflation as measured by the LIK evolved over this 11 years. The data source stemmed from the Swiss Federal Statistical Office and can be found here.
The year 2022
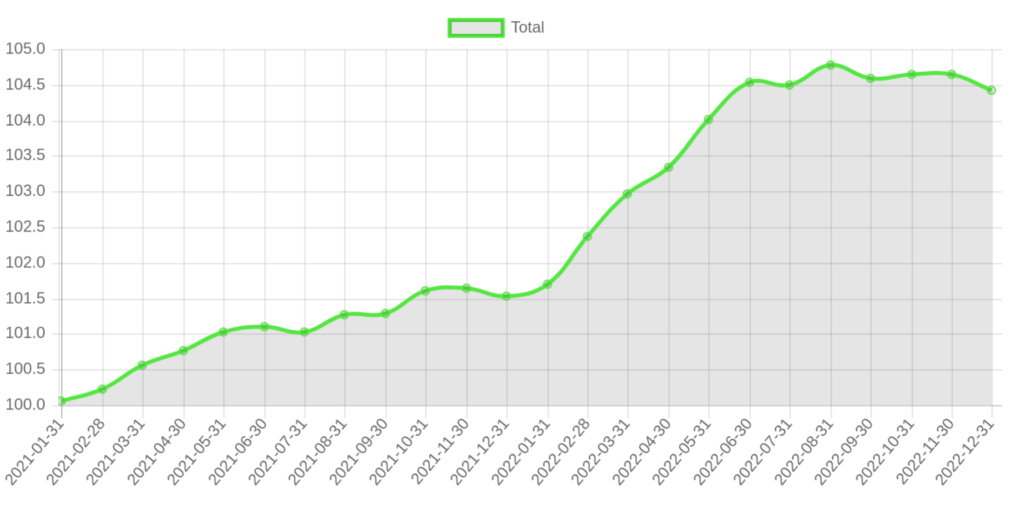
Even though the inflation in Switzerland was minimal over the twelve years from 2010 the 2022, we see a steep increase in the year 2022 as shown below. Over the whole year the total inflation edged up 2.8%. What is very interesting is that the major part of this increase happened during the first part of 2022. Between the beginning of July 2022 and the end of December 2022 the inflation measured by LIK went actually slightly down.
The driver for the inflation in 2022
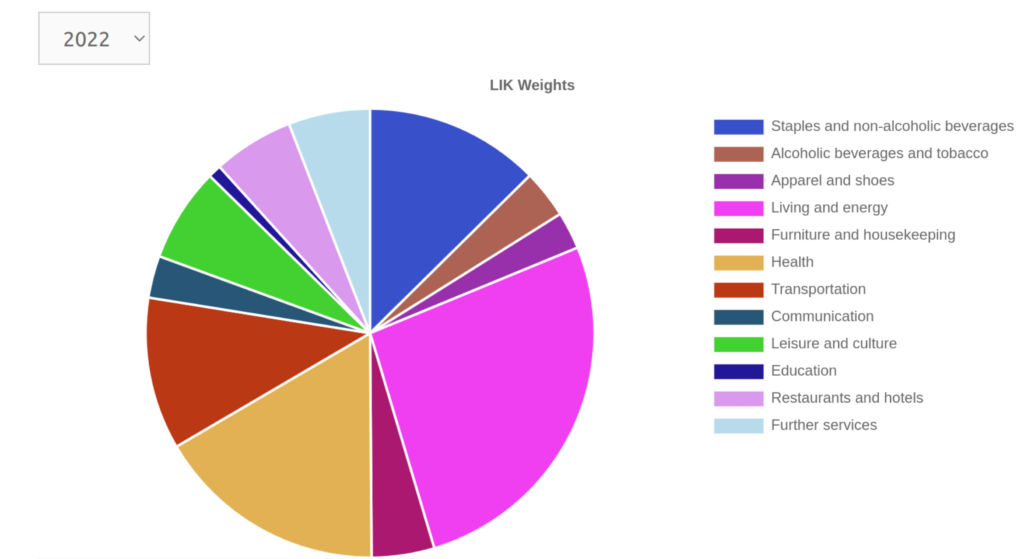
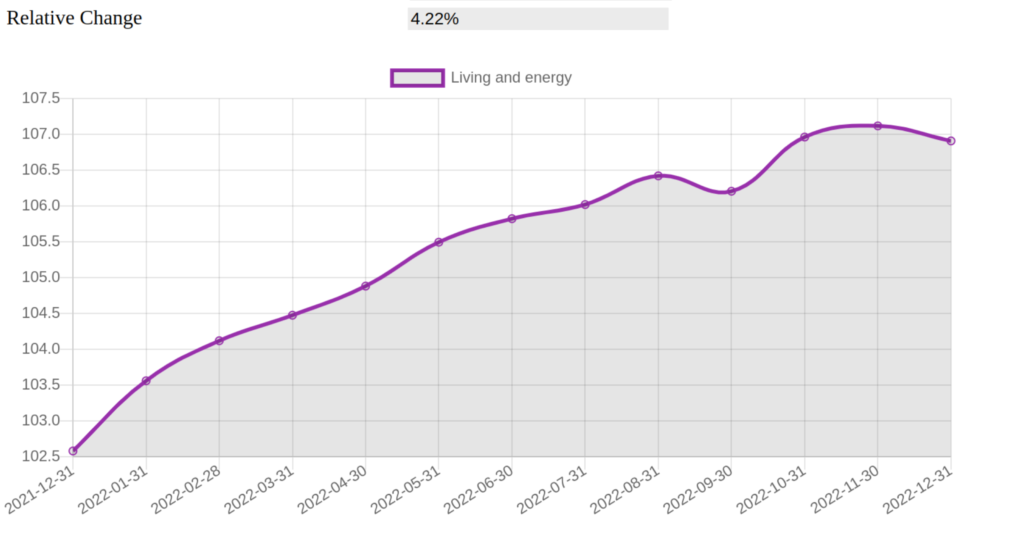
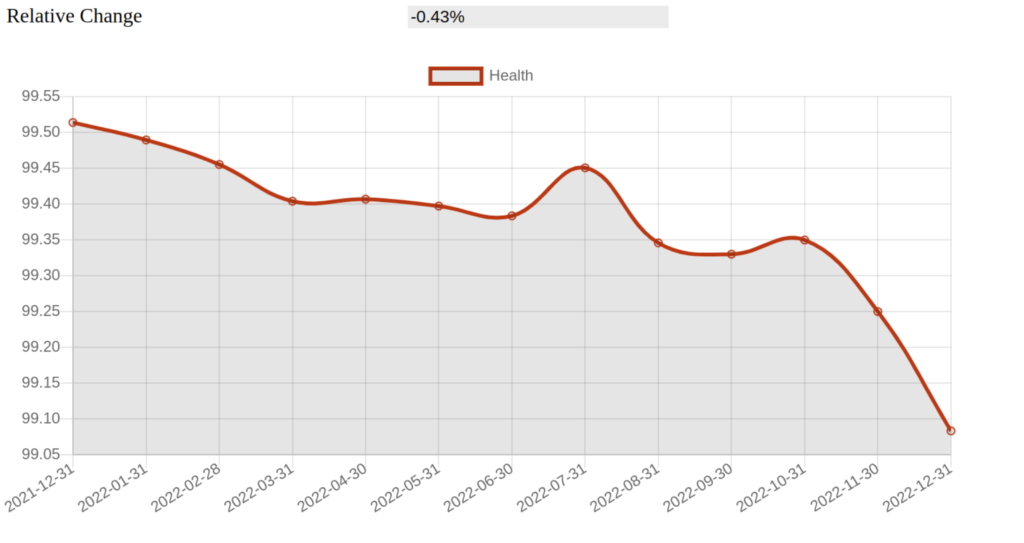
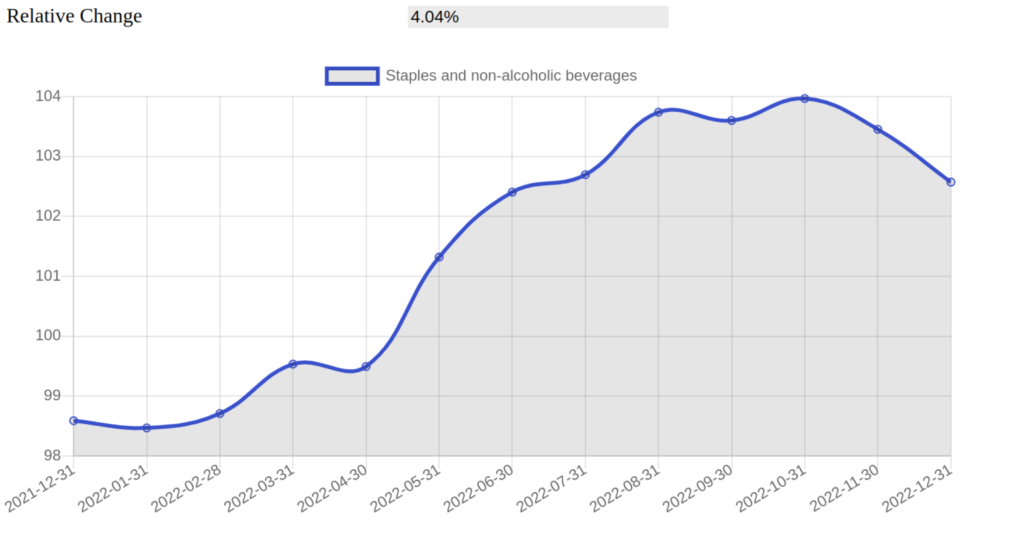
In the preceding blog entry I analyzed how the weights of the different categories of the LIK evolved over time. In the pie chart below you can see the weights for the different categories of the LIK for the year 2022. The category Living and energy has the biggest weight with 26.6%. In the second plot below you can see that the this category alone increased by 4.22% in 2022. The second biggest category in terms of weight is health. Looking at the third graph below we see that the health category actually ticked down by -0.43% throughout the year 2022. This is somewhat surprising considering that the health premiums increased by 6.6% on average for 2023. Another category that was reported in the media was Staples and non-alcoholic beverages. As can be seen in the fourth figure below this category increased by 4.04%. This is a quite significant increase.
Playground
In the below graph you can visualize how the inflation evolved over time for either the whole LIK or any category. You can select the desired period that you are interested from a range between 1982 and 2022. The data source stemmed from the Swiss Federal Statistical Office and can be found here. If you are interested in the technical details on how such a dynamic graph is created, check out this README section on Github.
To play around with the tool, go to the tracker here.
Viel Spass!