Is it pure magic or not?
A few months back when I checked out the iShares Swiss Dividend Select ETF, I asked myself continuously how exactly did they end up with those constituents and what are the underlying rules for the weighting of the components. In the below table table you can find the constituents of the SPI Select Dividend 20 Index on 3 October 2021. You can find the different weights of the constituents e.g. on the iShares Übersichtswebsite.

To answer the question of how they ended up using those constituents I started to comb through the methodology of SIX that gives more details on how the constituents are computed for all the various indices of SIX. With regards to the SPI Select Dividend 20 index one reads the following on page 35:
The index universe of the SPI Select Dividend 20 Index is the SPI. To be included to the pre selection list candidates
need to fulfil the following 3 criteria:
– Minimum average daily traded volume (ADTV) of CHF 2 million over the last 12 months.
– The issuer must have distributed a dividend in at least 4 out of the last 5 years. This includes the dividend
announcement or payment of the current year and the dividend payments of the previous 4 years.
– A positive pay-out ratio (Gross dividend per share / Earnings per share). Instruments with a positive pay-out ratio qualify for the pre-
selection list if they are not among the largest 10% of all instruments with the highest pay-out ratio.The instruments on the pre-selection list are ranked by their dividend yield (Gross dividend per share / Price of the share) in a descending
order. If an issuer has more than one share line which fulfils the preselection rules, only the line with the highest
dividend is chosen for the final list.The 30 best-ranked instruments are selected to the final selection list. If there are less than 30 instruments which
fulfil the stated criteria all of them are selected to the final selection list. On the final selection list, the instruments
are ranked based on their profitability (ROIC) in descending order. The 20 highest ranked instruments are selected as
the index components
The aim of the this blog entry is to dissect the rules laid out by SIX and check how they correspond to current data at one single day. The example day was around the 1 October 2021. Please note, I cannot guarantee completeness and correctness of the data represented below. The fundamental data was sourced form marketscreener.com.
Furthermore, sometimes I had to use slightly adapted rules from the ones defined by SIX since I did not have all the data available for all the criteria as you will realize when reading through the detailed computations. However, I find it still very instructive to go through it step by step.
Minimum average daily traded volume
According to the rules defined by SIX the following threshold mustn’t be violated when it comes to the minimum average daily traded volume:
Minimum average daily traded volume (ADTV) of CHF 2 million over the last 12 months.
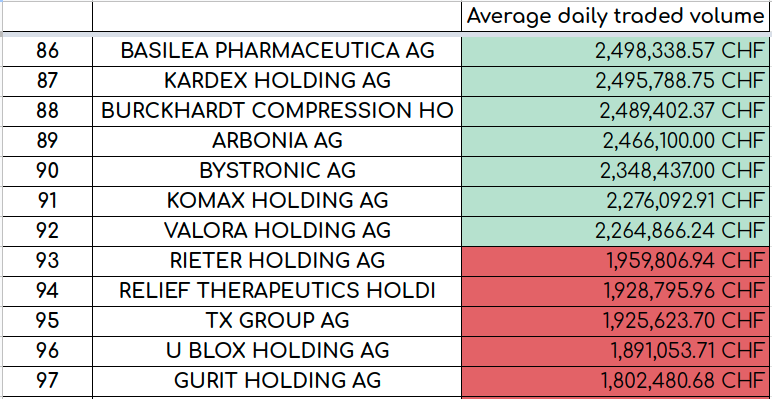
The average daily traded volume refers to the total amount of daily traded shares expressed in Swiss francs per day in average. For this computation I have only the number of the average of the last 20 days available. Sorting all constituents of the SPI and sorting by the average daily traded volumes one notices that the top 20 stocks are way above the limit of 2 Millions stated by SIX as shown in the table below.:
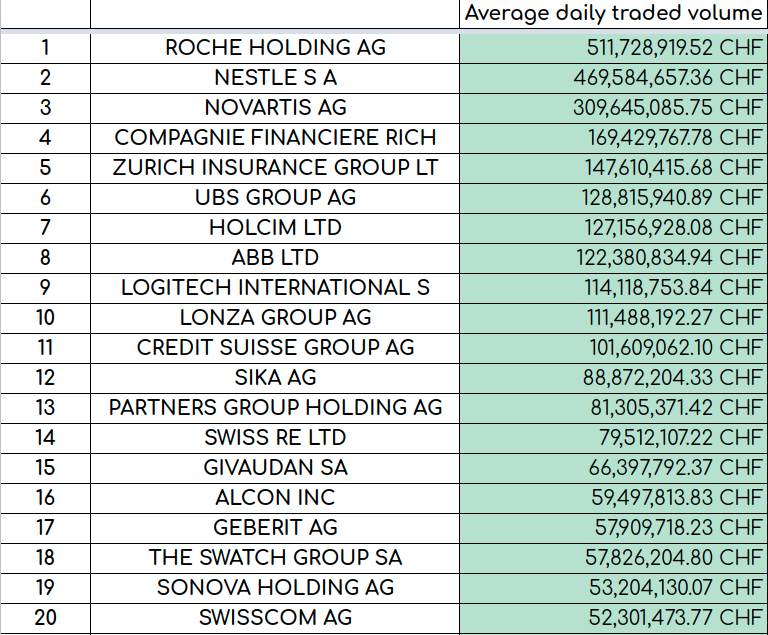
According to my numbers 92 constituents of the SPI fulfill the requirement of at least having 2 Millions Swiss francs in average daily traded volume. All stocks below this limit would violate this threshold.
Years of distributed dividends
According to the rules defined by SIX the following needs to be fulfilled:
The issuer must have distributed a dividend in at least 4 out of the last 5 years. This includes the dividend
announcement or payment of the current year and the dividend payments of the previous 4 years.
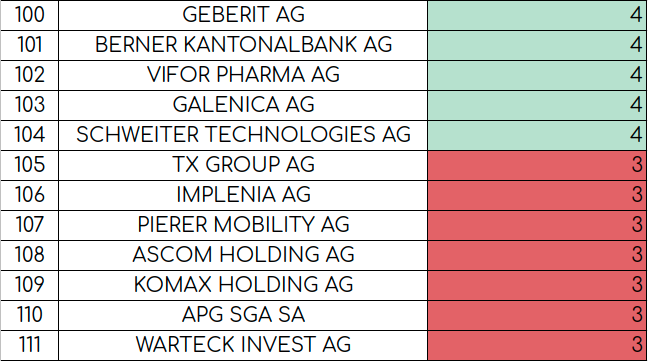
Unfortunately, I have only the dividend data available form the 2018 to 2021. So I adapt this rule slightly and request for the stock to be considered to have 4 out of the last 4 years a dividend distributed or announced/estimated for the current year. Applying this criterion to all constituents of the SPI we learn that 104 stocks paid a dividend in the last four years including the year 2021.
Payout ratio
According to the rules defined by SIX the following needs to be fulfilled:
A positive pay-out ratio (Gross dividend per share / Earnings per share). Instruments with a positive pay-out ratio qualify for the pre-
selection list if they are not among the largest 10% of all instruments with the highest pay-out ratio.
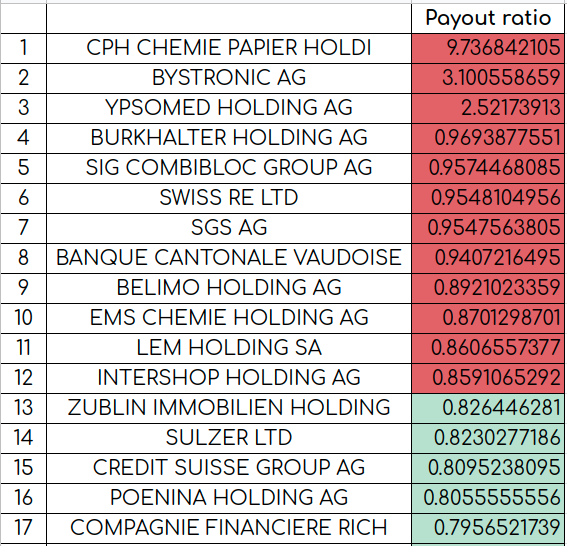
So going through the list of the SPI constituents I ended up with 122 stocks that had or should have a positive payout ratio for the year 2021:
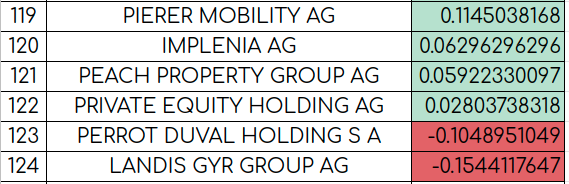
On top of that, the issues with the highest 10% cannot be considered according to the rules of SIX. To get the threshold I did the following:
122 * 10% / 100 = 12.2
Then I floored this number to 12 i.e. the 12 stocks with the highest payout ratio are discarded:
The pre-selection list
All the stocks that fulfill the three above introduced criteria i.e. average daily traded volume, years of distributed dividend and the payout ratio end up on the so-called pre-selection list. The order of this pre-selection list is determined by the dividend yield as SIX writes:
The instruments on the pre-selection list are ranked by their dividend yield (Gross dividend per share / Price of the share) in a descending
order. If an issuer has more than one share line which fulfils the preselection rules, only the line with the highest
dividend is chosen for the final list.
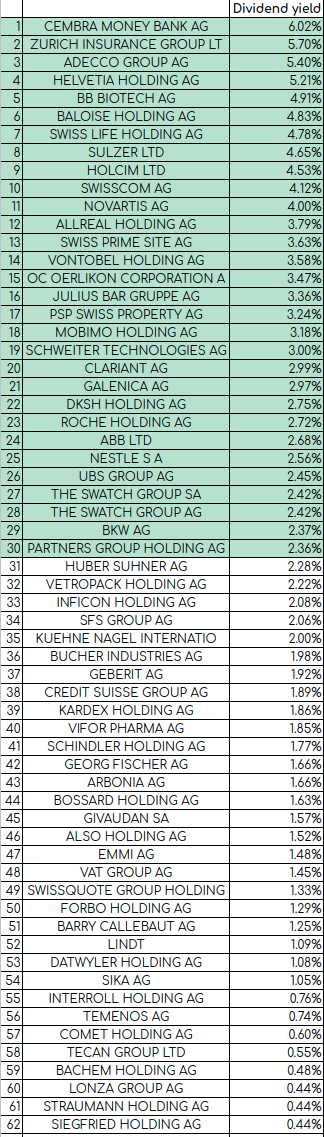
The list below is the pre-selection sorted by the current yield in a descending order list. I considered the dividend or estimated dividend yield for the year 2021. The final selection consists only of the 30 best ranked stocks according to SIX:
The 30 best-ranked instruments are selected to the final selection list.
I marked the 30 best ranked instruments in green color in the table below:
The final selection list
SIX applies the following rule to get the final selection list:
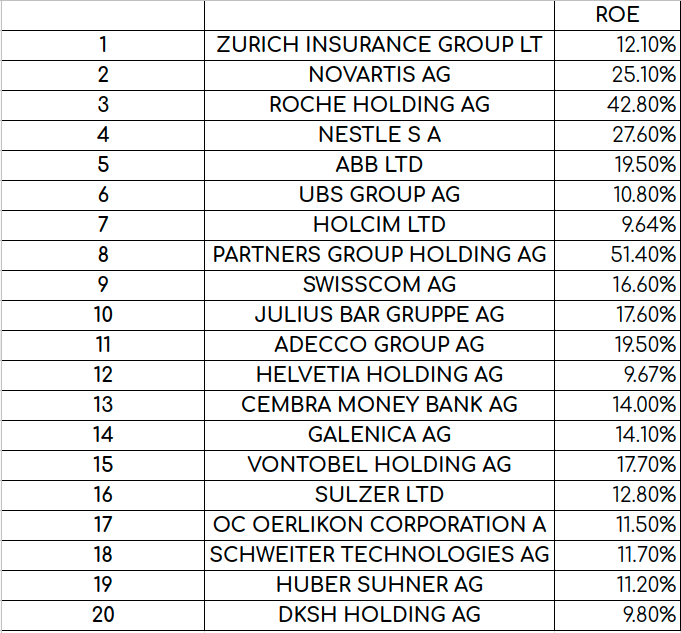
On the final selection list, the instruments are ranked based on their profitability (ROIC) in descending order. The 20 highest ranked instruments are selected as the index components.
The first question is to clarify what is ROIC. It stands for Return on Invested Capital. It is a number that divides the net operation profits after tax by the invested capital where the invested capital is the debt and the equity. According to investopedia there are many ways to compute this number. It is a number associated with the profitability of a company because the ratio essentially tells how well the raised capital is invested. Unfortunately, I do not have the ROIC for all the stocks of the SPI available. Hence, I decided to use as an alternative measure for profitability namely the Return on Equity (ROE). ROE is a ratio stemming from dividing Net Income by Average Shareholders Equity. More details can be found in investopedia. In the second column below you can find the 20 stocks with the highest ROE from the pre-selection list i.e. the constituents of the index.
The weighting of the components
I believe we have already come quite far with the final constituents of the index as shown in the table above. Naturally, the questions arises on how the single constituents are then weighted in the index. Counter to a lot of other indices which are solely weighted by the market capitalization of the components the additional influence of the dividend yield is considered for this specific index as SIX writes:
The components of the index are weighted by their Dividend Yield. Therefore the freefloat market capitalization is
multiplied with a capping factor.
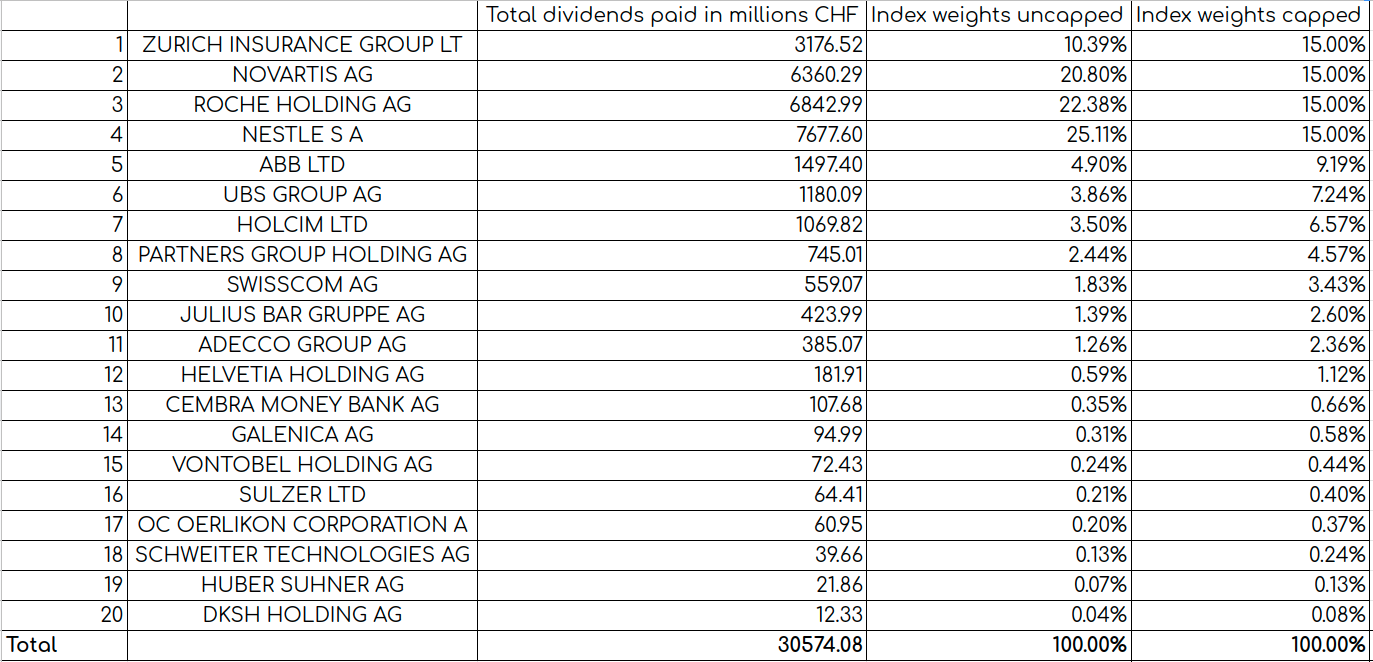
I must admit that it was not straight forward to me from the beginning to grasp what exactly is meant here with the capping factor. After some studying I believe that the capping factor is just the dividend yield per company. It makes sense in this way because if one multiplies the free float market capitalization with the dividend yield one gets the total amount of dividend paid to the “free float” shareholders. This number is then the normalization metric used to weigh the twenty constituents of the index. To better understand this, I created a table that contains the total dividend paid in millions Swiss francs with regards to the free float capitalization. Furthermore, I have computed the index weights uncapped i.e. if one only takes the total dividends paid in millions as normalization level without any capping threshold. You can see the uncapped values in the fourth column in the table below. However SIX clearly states that the index components shall not exceed a weight of 15%:
In addition the capping factor ensures that no component exceeds a weight of 15%.
Looking at the fourth column containing the uncapped index weights one sees that the weights for the stocks of Novartis AG, Roche Holding AG and Nestle SA would violate that threshold when directly taking the uncapped weights. The reason for this is that the total amount of paid dividends for those three companies is significantly higher since their market capitalization is much higher. Thus, to comply with with this rule I toke away the percentages weights from those three stocks and redistributed them among the other 17 stocks. Again these residual percentages were distributed based on the normalization step that takes into account the total dividends paid analogous to the initial weighting. I printed then the final weights in the last column of the table below. You might have noticed that now four companies are at the threshold of 15%. When checking the iShares website that tracks this index CHDVD you notice that the same stocks appear to have weights around this threshold. They are not exactly 15% because after the re-balancing the share price will change and thus the relative weights in the index. Also please note, this statements is true if one checks for the weights on the 7 October 2021 on the iShares website. I take this as an indication that my applied logic for the computation with the normalized weights should not be too far off.
Comparison of own computation to SIX’s list
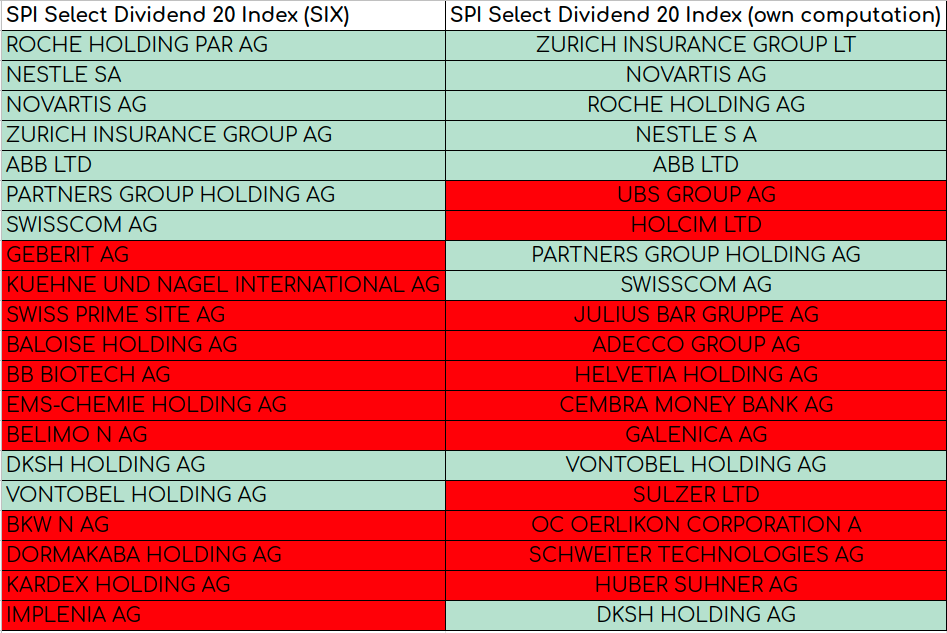
The question arises of how well did my own computation match up with the selected constituents by SIX. To compare the two, I visualized the constituents selected by SIX in the first column below and mine in the second column. Stocks marked in green match up while the red ones do not match. As can be seen the top five constituents can be found in both lists. On top of that one finds Partners Group Holding AG, Swisscom AG, Vontobel Holding AG and DKSH Holding AG in both lists. This amounts to a matching of 9 single constituents respectively to an overall matching of 77.72% of the complete index considering the weighting factors in my list. Still 11 constituents are different. I believe it is worth to consider some examples to understand on why they made it to my list but not included in SIX’s list respectively vice versa. One reason for the discrepancy might also be that according to SIX, the index review is done on the 3rd Friday of March while my computation based its numbers at the beginning of October. I would like to consider two stocks in more details and try to come up on why they are not included in both lists namely UBS Group AG for my list and Geberit AG for the SIX’s selection list.
Once a year, the index review is implemented on the 3 rd Friday of March. A pre-selection list is created for the annual
review in March based on the last trading date of February as the cut-off date.
UBS Group AG
The UBS AG made it to my list but is not part of the SIX’s selection list. I check out the UBS website. I conclude that UBS paid a dividend in in all the years from 2016 to 2020. Thus, the criterion with regards to 4 out of the last 5 years a dividend paid should be fulfilled. Also the payout ratio should have been positive for the last two years. On the other hand, I found that the Return on Assets (ROA) with 0.63 for the year 2020 is rather small while the ROE with 11.5 looks okish. This could be the reason that the stock did not make it into SIX’s final selection list because the profitability measure they apply (ROIC) was not good enough.
Geberit AG
The company Geberit AG is part of the selection list of SIX but did it not make it to my list. Checking out all the criteria for this company I see that Geberit AG was actually on my pre-selection list. However since the dividend yield or the estimated dividend yield was only 1.92% for the year 2021 it was at position 37 and did not make it into the final selection list. The dividend yield for Geberit AG was 2.06% for the year before. It could well be that the number in March 2021 when SIX computed the constituents was high enough to make into the pre-selection list. Also please note, at the time of the re-balancing Geberit AG had a share price of 576.20 CHF while now (8th October 2021) it is around 687 CHF which is an appreciation of about 19% i.e. in March 2021 the estimated dividend yield for 2021 would have been around 2.29%.
Conclusion
My computation with the available data created a selection list that is close to the list of SIX for the top constituents. However, it falls short for constituents with smaller weights. I believe the reason for this shortfall is the timing of the computation, the available data in terms of backward time (only 4 out 4 years considered dividend instead 4 out of 5) as well as the profitability measure of ROE for my own computation instead of the ROIC that SIX employs. I still believe it is really interesting to do the calculation because essentially the effect of the dividend and the dividend yield respectively the profitability of the different stocks on the selection process are much better understood now in my opinion.