Three years ago I started to invest into the Vanguard Global ex-U.S. Real Estate ETF with ticker (VNQI). I found the ETF appealing due to its low expense ratio of 0.12%. The fund invests in real estate companies outside from the USA. E.g. it even has small exposure to the following real estate companies listed on the Swiss stock exchange according to Vanguard’s latest fund report of April 30, 2023

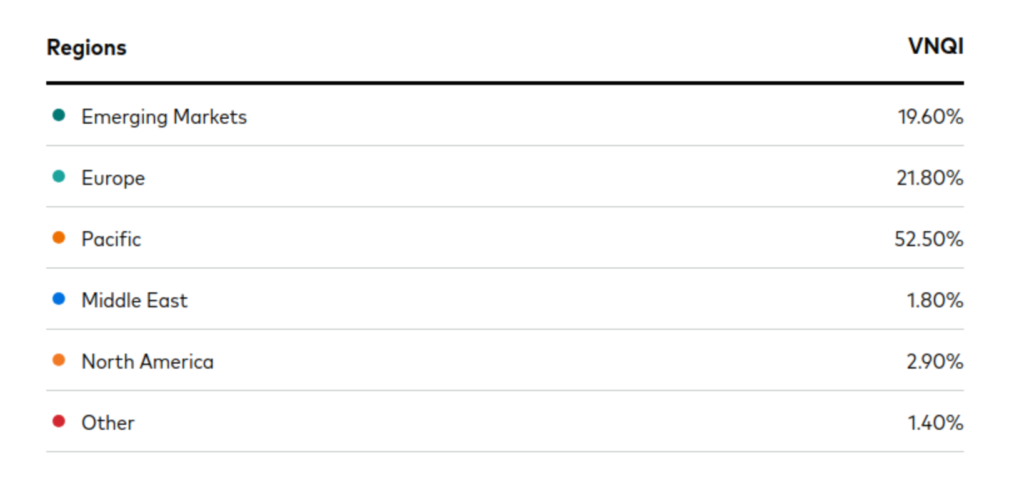
As shown below the fund covers quite big parts of the world:
Dividends of VNQI
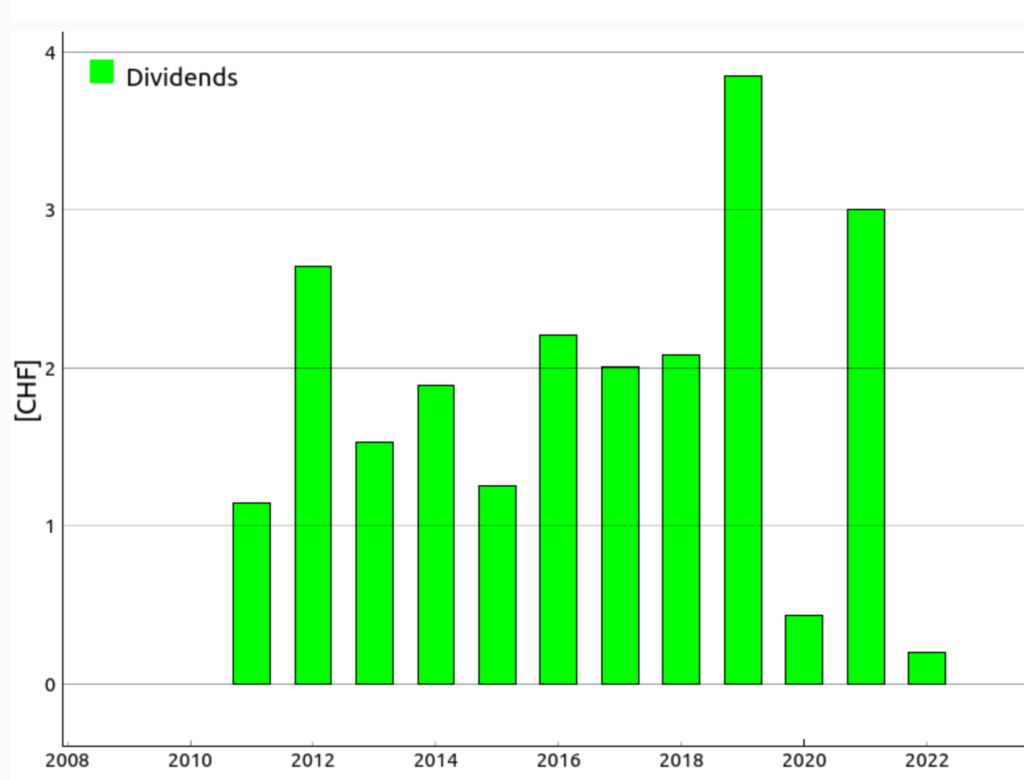
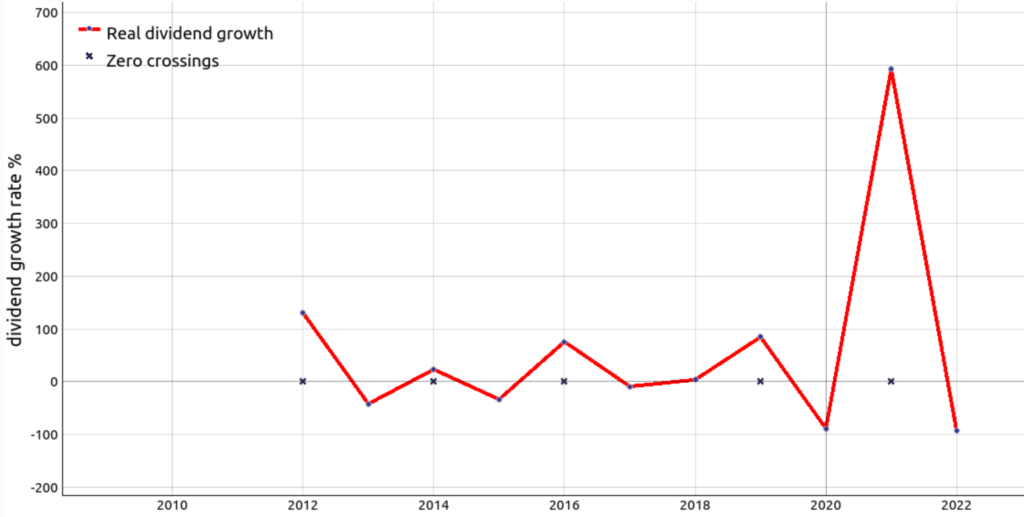
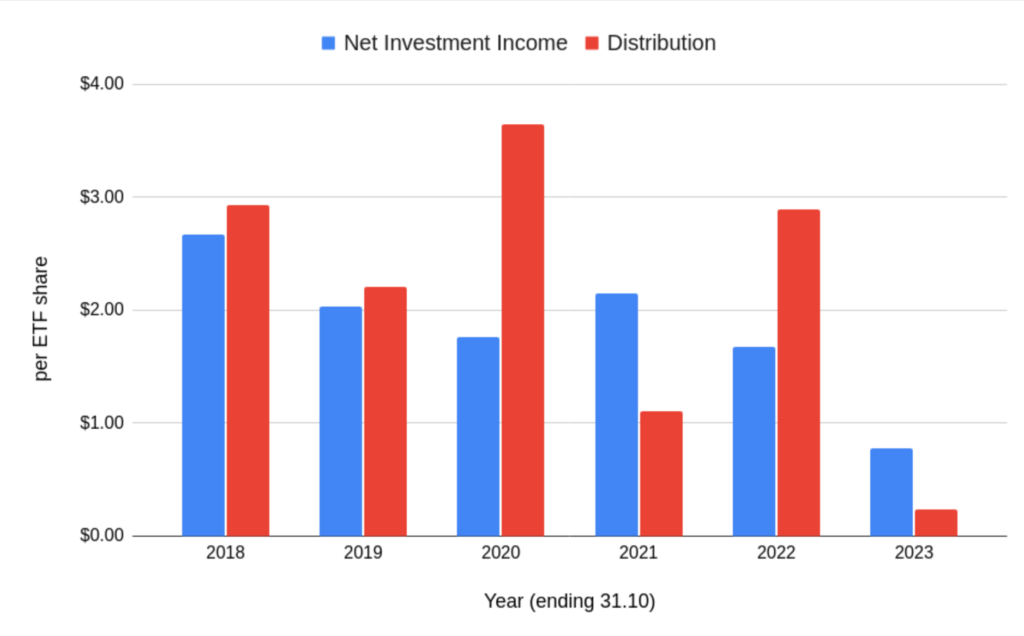
Now the dividend track record looks somewhat erratic lately. In the below bar graph I plotted the paid dividends per ETF share in Swiss Francs from the year 2011 until 2022.
Net Investment Income vs Distributed Dividends
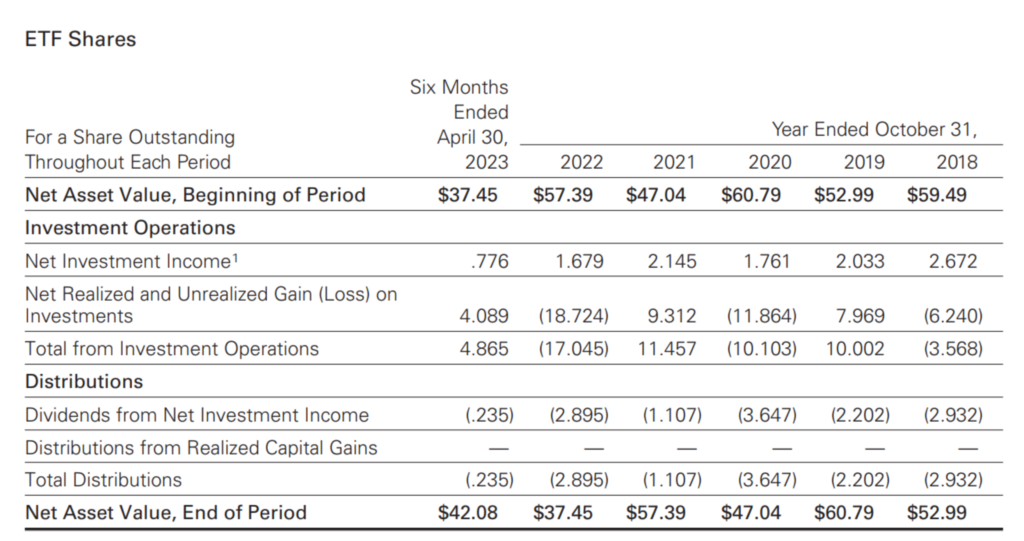
What bugs me is that for me a real estate investment should actually resemble a fixed income stream and not an investment with a wildly oscillating dividend. Moreover, I find this unpredictable behavior especially irksome for a fund that consists of more than than 600 different real estate companies distributed all over the world because with more diversification I would expect a smoother behaviour in terms of distribution. To shed some more light into this, I read through the semiannual report of this fund on the Vanguard website. In the third row “Net Investment Income” Vanguard lists the net investment income per ETF share for the current year 2023 as well years back to 2018. Please note, in Vanguard’s report the referred year is the business year that ends October 31. In the 9th row “Total Distributions” the total amount of the distributions per ETH share are listed. We already can see that those two numbers hardly add up if only years are considered in isolation. To better illustrate the situation, I have visualized the net investment income per ETF share vs distribution per ETF share per each business year in figure 6. We immediately notice that red and blue bars actually never have the same height in any year. Furthermore, what is odd is that the total distributed amount has surpassed in four of the six reported periods. The net investment income was only greater than the distributed dividends for the reported periods 2021 and 2023. What is even more startling is that the total of net investment income and distributions over the reported period from 2018 to 2023 is not even i.e. 1.95 USD per ETF share was more distributed than reported as net investment income per share.
Realized capital gain task the root cause?
Could the above-mentioned accumulated difference between total distribution and net investment income be explained with distribution stemming from realized capital gains? I strongly doubt that as the row in the above table called “Distribution from Realized Capital Gains” is just empty i.e. zero.
Varying share count the root cause?
One potential explanation for the discrepancy between net investment income and distributed dividends could be the share count of the ETF varies strongly over the year i.e. there is difference of the number of outstanding ETF shares during collection periods of dividends from companies versus when the ETF distributes it to the holder of the ETF shares. However, this theory is kind of refuted when checking the statement of changes in net assets. As can be seen for both reported period 2022 as well as 2021 the total amount of net investment income never matches the total amount of distributions in a single year.
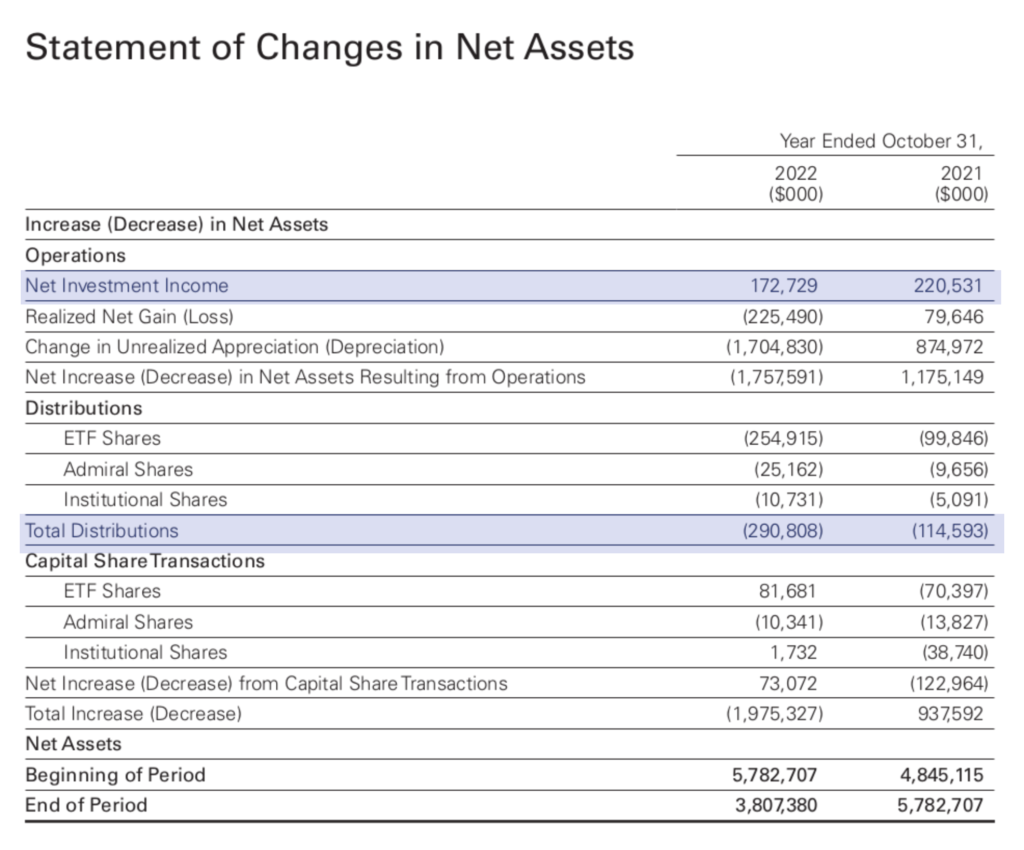
Figure 7: Excerpt of statement of change in net assets of VNQI. Source: Vanguard
What does Vanguard say?
With regards to the dividend distributions we can find the following in the report in chapter “Notes to Financial Statements”:
Distributions: Distributions to shareholders are recorded on the ex-dividend date. Distributions
are determined on a tax basis at the fiscal year-end and may differ from net investment income
and realized capital gains for financial reporting purposes.
Source: Vanguard Annual Report – Vanguard Global ex-U.S. Real Estate
Index Fund – October 31, 2022
To be honest, I do not really know what is exactly meant with “on a tax basis” and “for financial reporting purposes“. I could imagine that since the fiscal year ends on the October 31 of each year that causes some shift. I would need to ask Vanguard whether they could shed some more light into it.
Conclusion
We could establish that the Vanguard Global ex-U.S. Real Estate ETF with ticker (VNQI) has an erratic distribution history. At this point it is not 100% clear to me how this systematic difference could be explained. While I will not trim my position in VNQI, I will not add more shares so long I have not clarified this further.