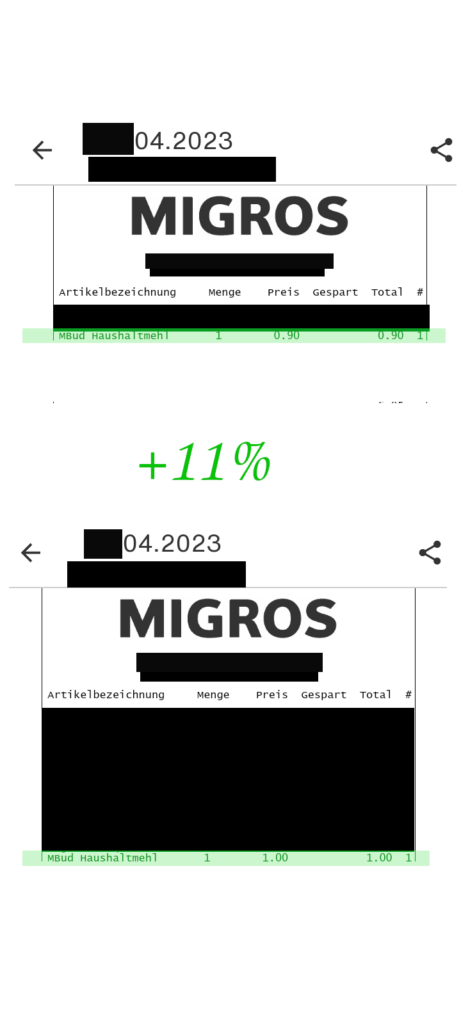
Throughout the last year I have noticed that prices of several items in supermarkets in Switzerland have increased. Obviously, the inflation as explained in a earlier blog that has been prevalent has played a major part here. Moreover, it appeared to me that prices for the cheap lines e.g. M-Budget at Migros have increased over-proportionally. E.g. for a very long time the 1 kg of flour at Migros had been priced at 0.9 CHF. Then at some point in April 2023 the price for this product suddenly increased 1 CHF. This an eye-watering increase of 11 percent. As a proof of this I have depicted two Migros receipts that show this change in April 2023. I think an increase of 11% is quite significant. However, I am not saying that such an increase is unwarranted. Furthermore, I believe an increase of 0.10 CHF does not make a household budget explode per se.
And is there any data in the Internet that corroborates my perception?
The Beobachter as well as NZZ reported about price increases in the grocery shops in Switzerland during the last year. However, so far I have not found any tool out in the Internet that would show how prices for single products of the M-Budget line evolve. I do not like that such price increases creep in unnoticed over time. Hence, I decided to a create a tracking tool that monitors the prices of the M-Budget line on a weekly basis.
How the M-Budget prices are collected
In the beginning I thought I would only collect certain distinct products that I mainly purchase. The naive approach would have been to write down the prices whenever you go to the job physically. However, this is would be quite a cumbersome endeavor and prone to make mistakes. Thus, my second idea was to use the Migros App that I have installed and use very often. The base idea would have been to somehow crawl the app for prices of M-Budget products. After some back and forth I realized that the much easier approach would be to collect the prices directly from my PC via the M-Budget overview website. The detailed explanation of how the tracker works is given on Github.
The M-Budget tracker explained
Currently, the tracker looks like this:
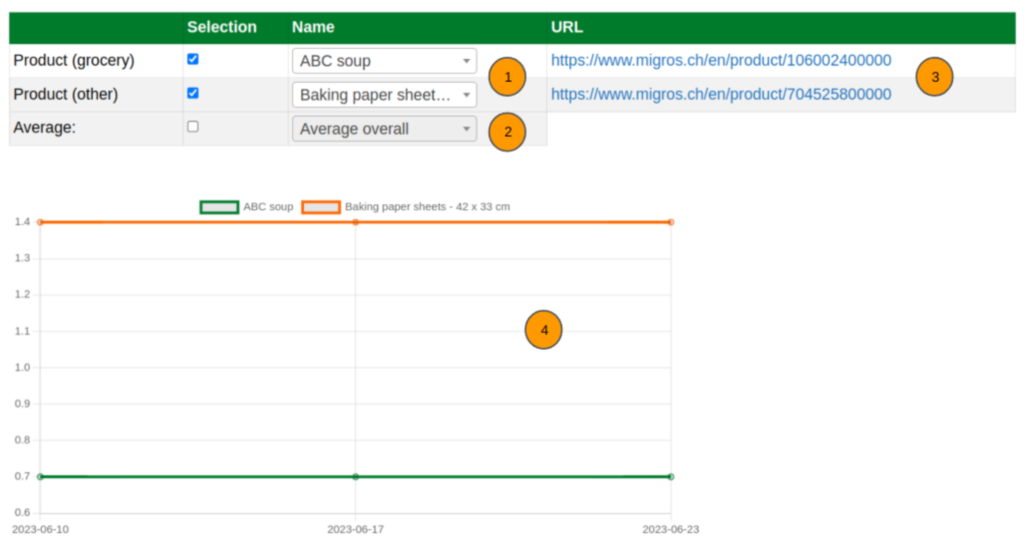
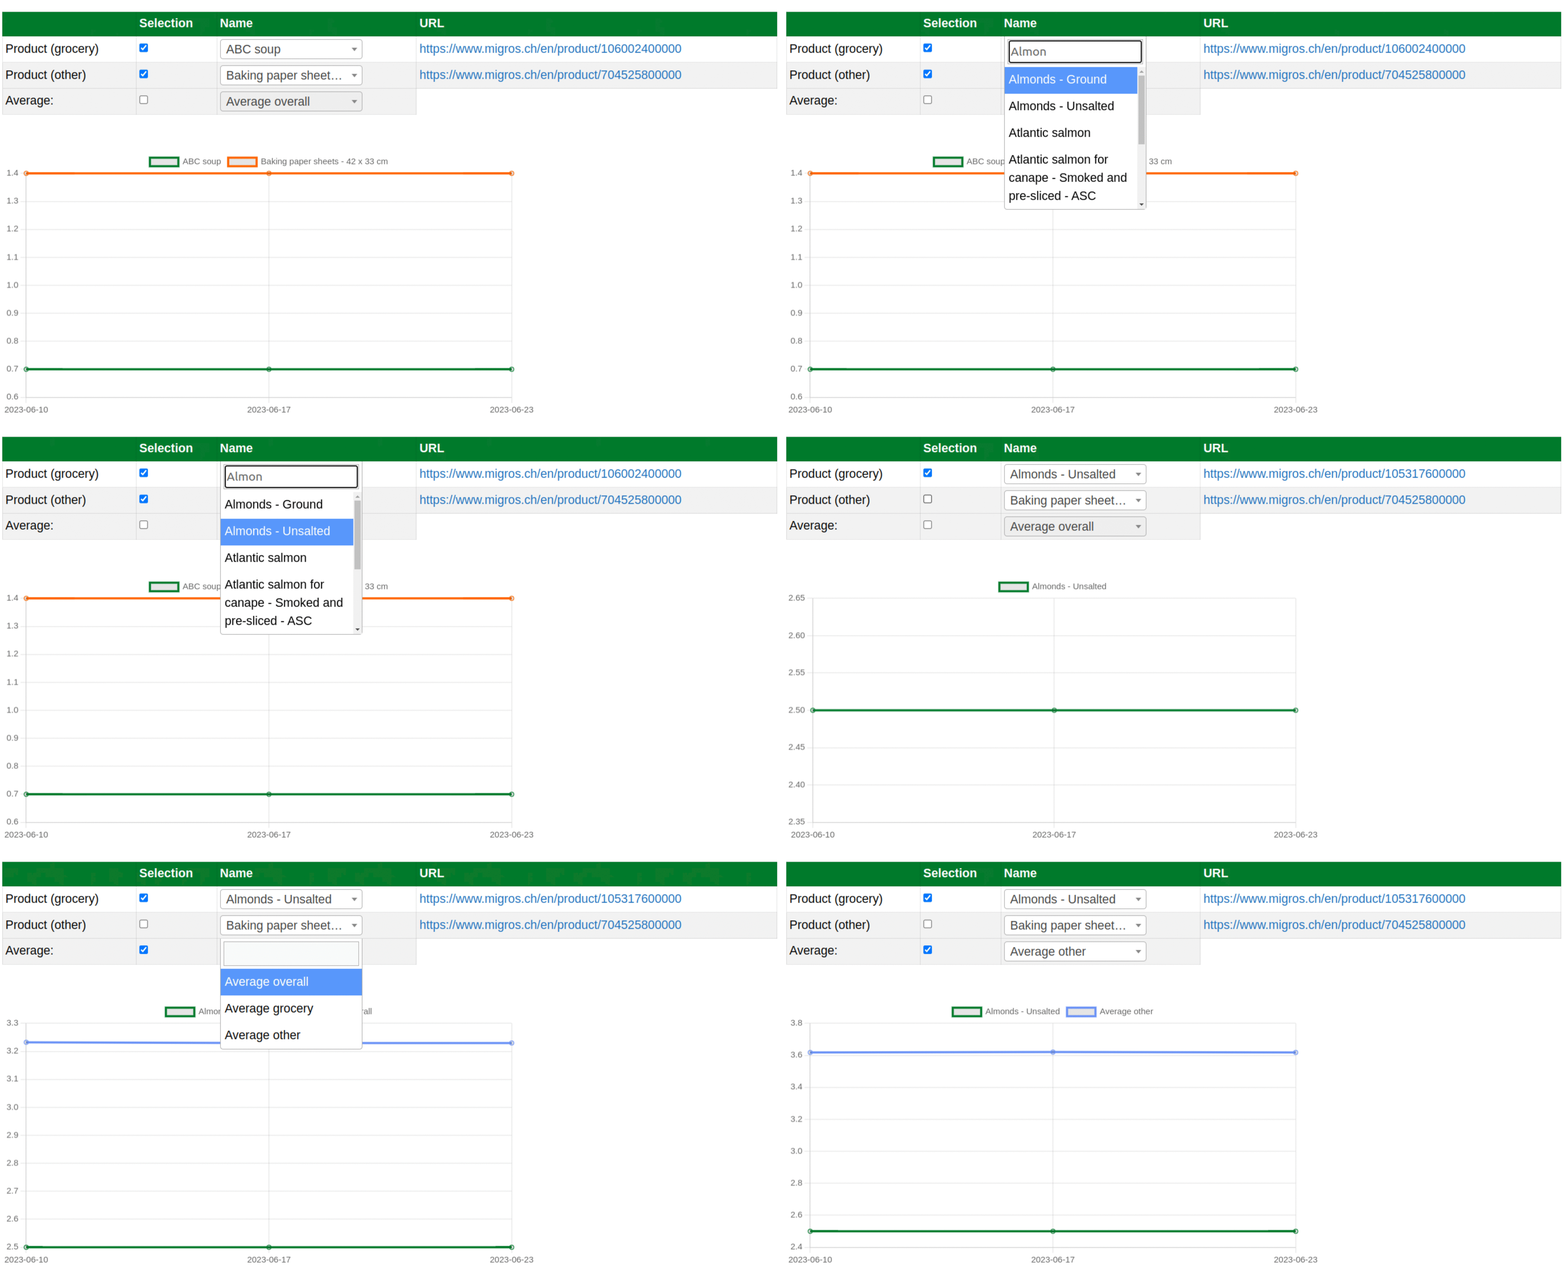
The tracker consists of four main elements:
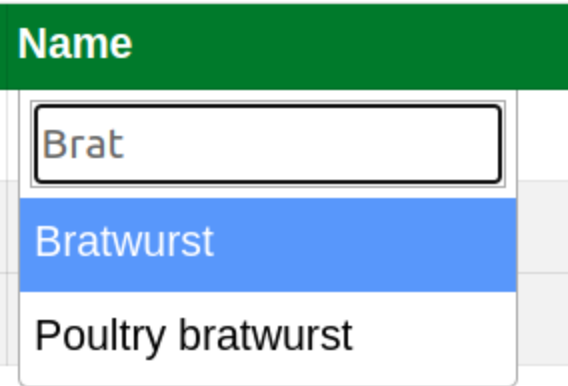
1: Production selection. There are two dropdown menus for the two main categories: Grocery and other. If you click in any of the two you can either scroll through those product or even search for a specific one:
2: Average selection: You can decide between three different average indicators:
- Average overall: Average over all available M-Budget products
- Average grocery: Average over all grocery M-Budget products
- Average other: Average over all other M-Budget products

3: URL link to the product on the Migros website:

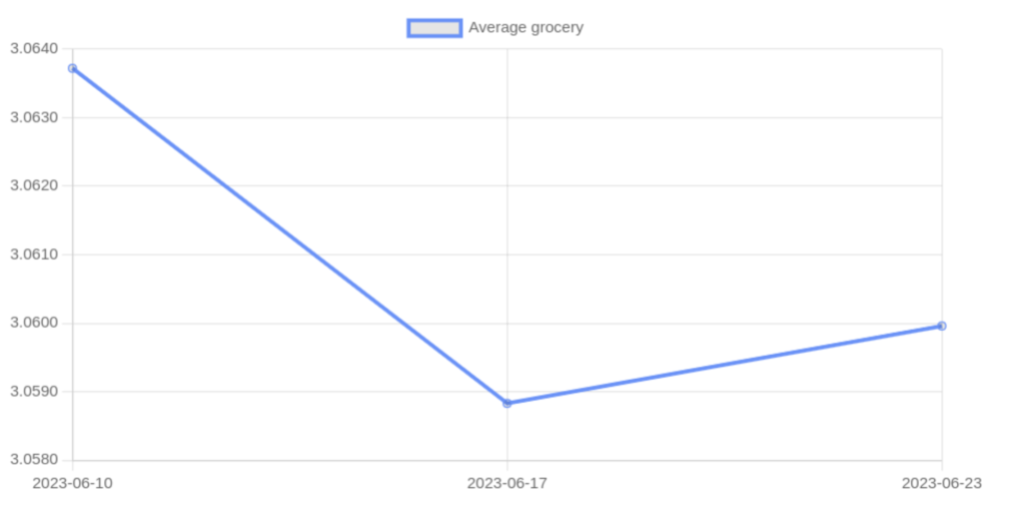
4: Plotted graph region: In the plotted graph region the price development of the selected product and/or average is depicted:
Future outlook
As you can see the the M-Budget price tracker consists of very few data points since the tracking just started. It should become more interesting over time to see how the prices evolve. Furthermore, I might add functionality that shows which products’ prices moved more over certain periods or add more meaningful average indicators.
The M-Budget tracker can be accessed in the Toolbox.
Have fun!