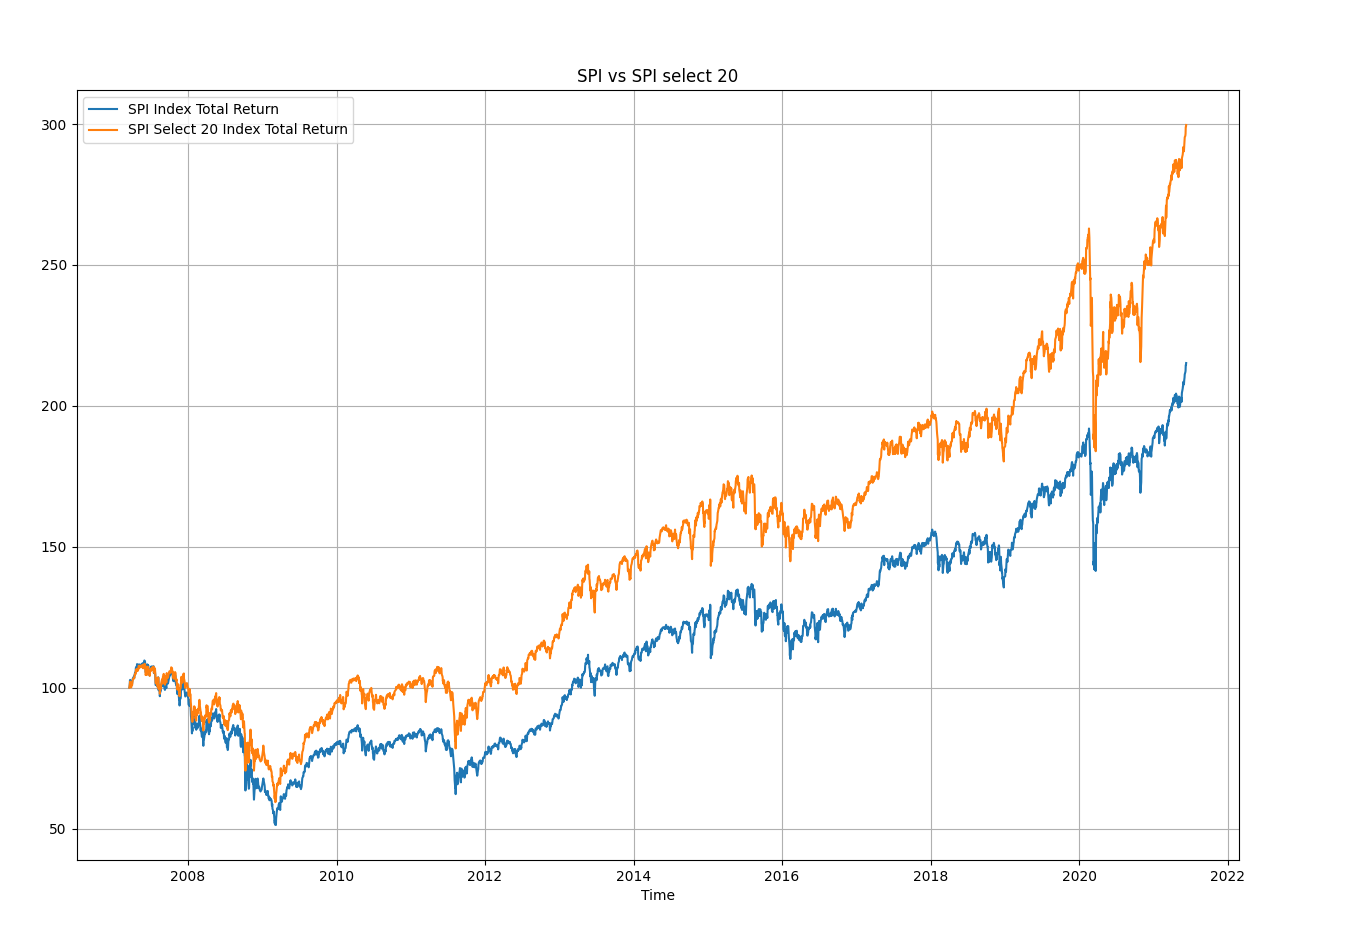
It’s true that true love might be an exaggeration. However, as a Swiss investor I seek to invest a least a certain part of my investments in the Swiss market. On top of that I have a certain believe that investing in dividend yielding companies has advantages that I want to reap. The figure below shows the performance of the total return for the Swiss Performance Index (SPI) vs the total return of the the SPI select 20 index. The starting date of the data was March 19, 2007 and the end date was June 11, 2021 i.e. about 14 years. Both index values were set to 100 on June 19, 2007. On June 11, 2021 the index value of the SPI total return was at 215.2 while the index value of the SPI Select 20 was at 299.7. Thus, the average annualized return for the whole period was about 5.26% for the SPI while it was 8.16% for the SPI Select 20.

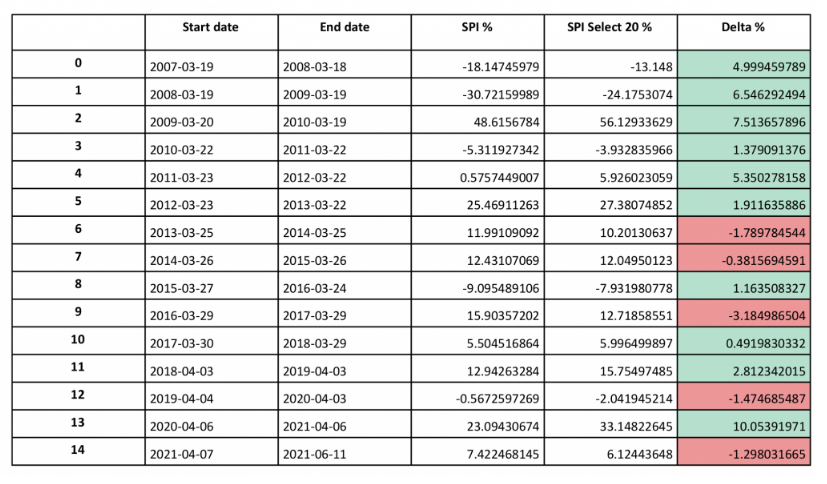
An averaged annualized return that is 2.9% higher is quite significant. In the table below I have computed the yearly return of the SPI and the SPI Select 20 in percentage and the difference of the two in the last column (delta). There are fourteen full year periods. The last row accounts only for 2 months. As can be seen the SPI Select 20 outperformed the SPI in 10 out of the 14 full year period (green cells in last column)

How to invest in the SPI Select Dividend 20 Index?
So very naturally the question arises on how to invest to the track this index. Luckily, there is an ETF that does exactly this: The iShares Swiss Dividend ETF stands readily available. In upcoming post I want to give more insights on what index this ETF is based on and try to show how they compute the constituents in more details.